
The stress-strain diagram is a graphical representation of the relationship between the applied stress and resulting strain within a material under load. It is used to study the mechanical properties of materials, particularly how they deform and ultimately fail under various types of loads.

The diagram provides information about a material’s mechanical properties, including its elastic modulus, yield point, ultimate strength, and fracture point, and is used by engineers to select materials for specific applications, design structures, and analyze failures.
Definition of the Stress-Strain Diagram
A stress-strain diagram is a graphical representation of the relationship between the applied stress and resulting strain within a material under load. This diagram is used to study the mechanical properties of materials, particularly how they deform and ultimately fail under various types of loads.
In the stress-strain diagram, the stress (σ) is plotted on the vertical axis, while strain (ε) is plotted on the horizontal axis. Stress is defined as the force (F) acting on an object divided by the cross-sectional area (A) of the object:

Elevate Your Engineering With Excel
Advance in Excel with engineering-focused training that equips you with the skills to streamline projects and accelerate your career.
Strain is the change in length (ΔL) of the object divided by its initial length (L₀). The formula to calculate strain is as follows:
Fundamental Properties of a Stress-Strain Diagram
A stress-strain diagram provides information about a material’s mechanical properties, including its elastic modulus, yield point, ultimate strength, and fracture point.
There are several key properties of stress-strain diagrams that engineers and scientists rely on:
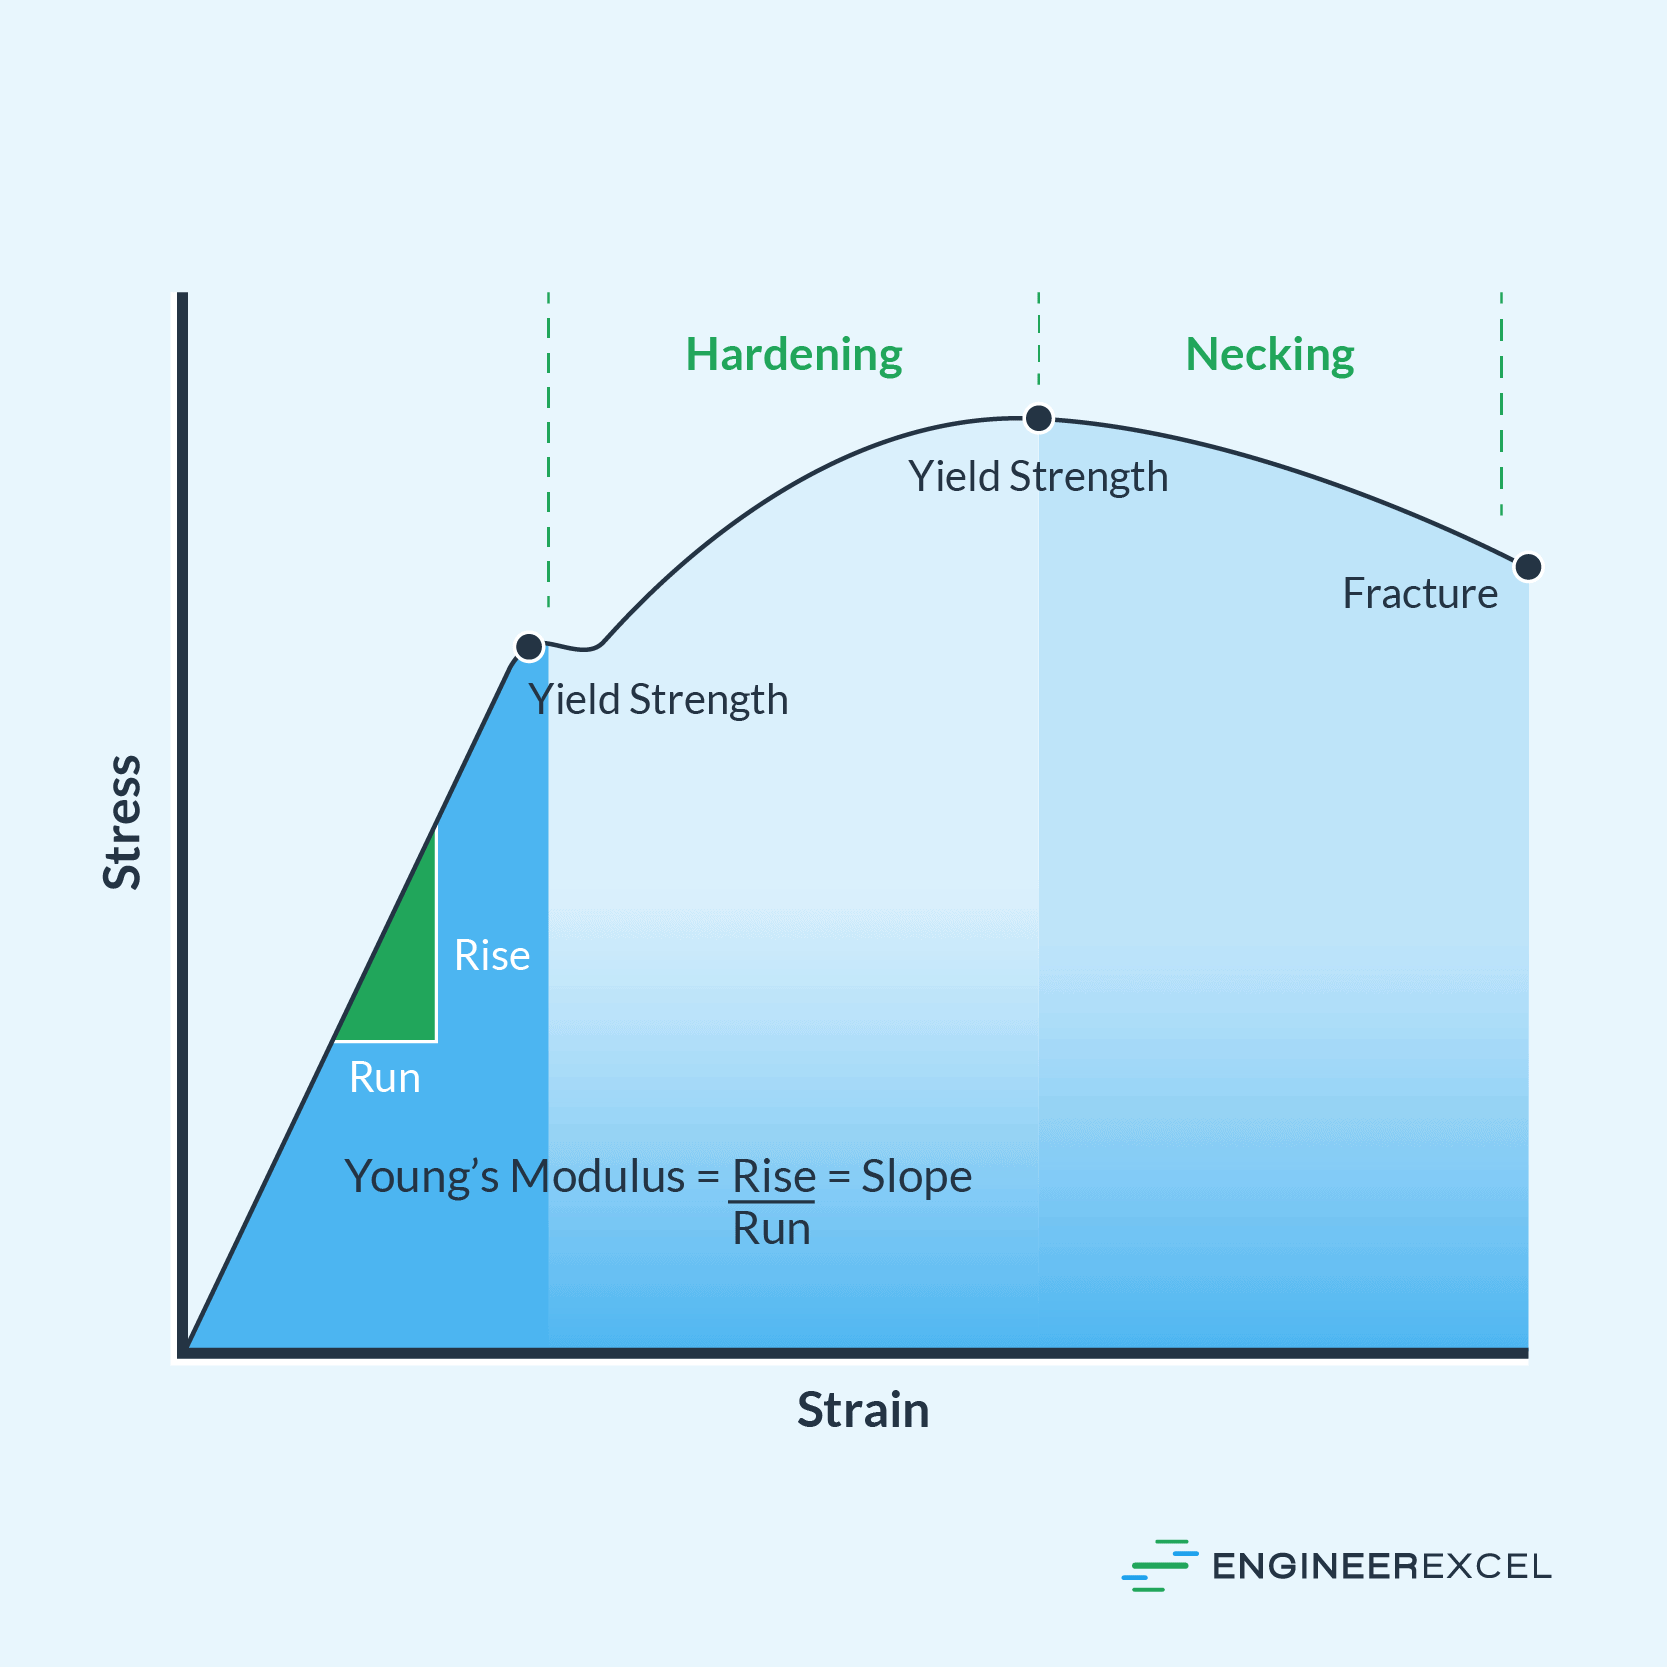
- Elastic modulus (E): Also known as Young’s modulus, this property represents the material’s stiffness in the elastic region, where the deformation is reversible. The elastic modulus is determined from the slope of the initial linear portion of the stress-strain curve (rise/run = Δσ/Δε) and is material-dependent.
- Yield point (σy): This point on the stress-strain curve indicates the transition from elastic to plastic deformation, where the material begins to yield or permanently deform under the applied stress. Beyond the yield point, the material won’t return to its original shape once the stress is removed.
- Ultimate strength (σu): The maximum stress a material can withstand before it breaks. This value is observed as the highest point on the stress-strain curve and marks the transition between plastic deformation and fracture.
- Fracture point (σf): The stress level at which the material breaks or fractures, signifying the end of its load-bearing capacity. This point occurs when the stress-strain curve suddenly drops to zero.
- Components of the Stress-Strain Diagram
There are several key stages of a stress-strain diagram, including the elastic region, plastic region, strain hardening region, necking region, and fracture point.
Elastic Region
The elastic region is the initial stage where stress is directly proportional to strain, following Hooke’s Law. In this region, the material will return to its original shape upon load removal. The slope of the stress-strain curve represents the material’s Young’s modulus, which is a measure of its stiffness. Materials with higher Young’s moduli are more resistant to deformation under load.
Plastic Region
Once the material reaches its yield point, it enters the plastic region. In this stage, the material undergoes permanent deformation, meaning it will not return to its original shape once the load is removed. The material’s response to stress becomes non-linear, and its properties, such as ductility and toughness, are critical for engineering applications.
Strain Hardening Region
As strain continues to increase, the stress-strain curve enters the strain hardening region. The material becomes stronger due to the formation of dislocations and the interaction of crystal lattice defects. In this region, the material is subject to work hardening, where increased strain leads to a higher stress required to cause further deformation.
Necking Region
Beyond the strain hardening region, the stress-strain curve reaches its ultimate tensile strength, which is the maximum stress the material can withstand. The necking region follows, characterized by localized reductions in the material’s cross-sectional area. This process weakens the material, making it more susceptible to failure.
Fracture Point
At the fracture point, the material reaches its breaking point and fails under the applied stress. The stress-strain curve terminates, indicating that the material has been separated into two or more pieces. The fracture point is often used as a criterion for material selection in engineering applications, taking into account factors such as brittleness or ductility.
Material Behavior and the Stress-Strain Diagram
Two major material categories are distinguished by their response on the stress-strain curve: brittle materials and ductile materials.
Brittle Materials Response
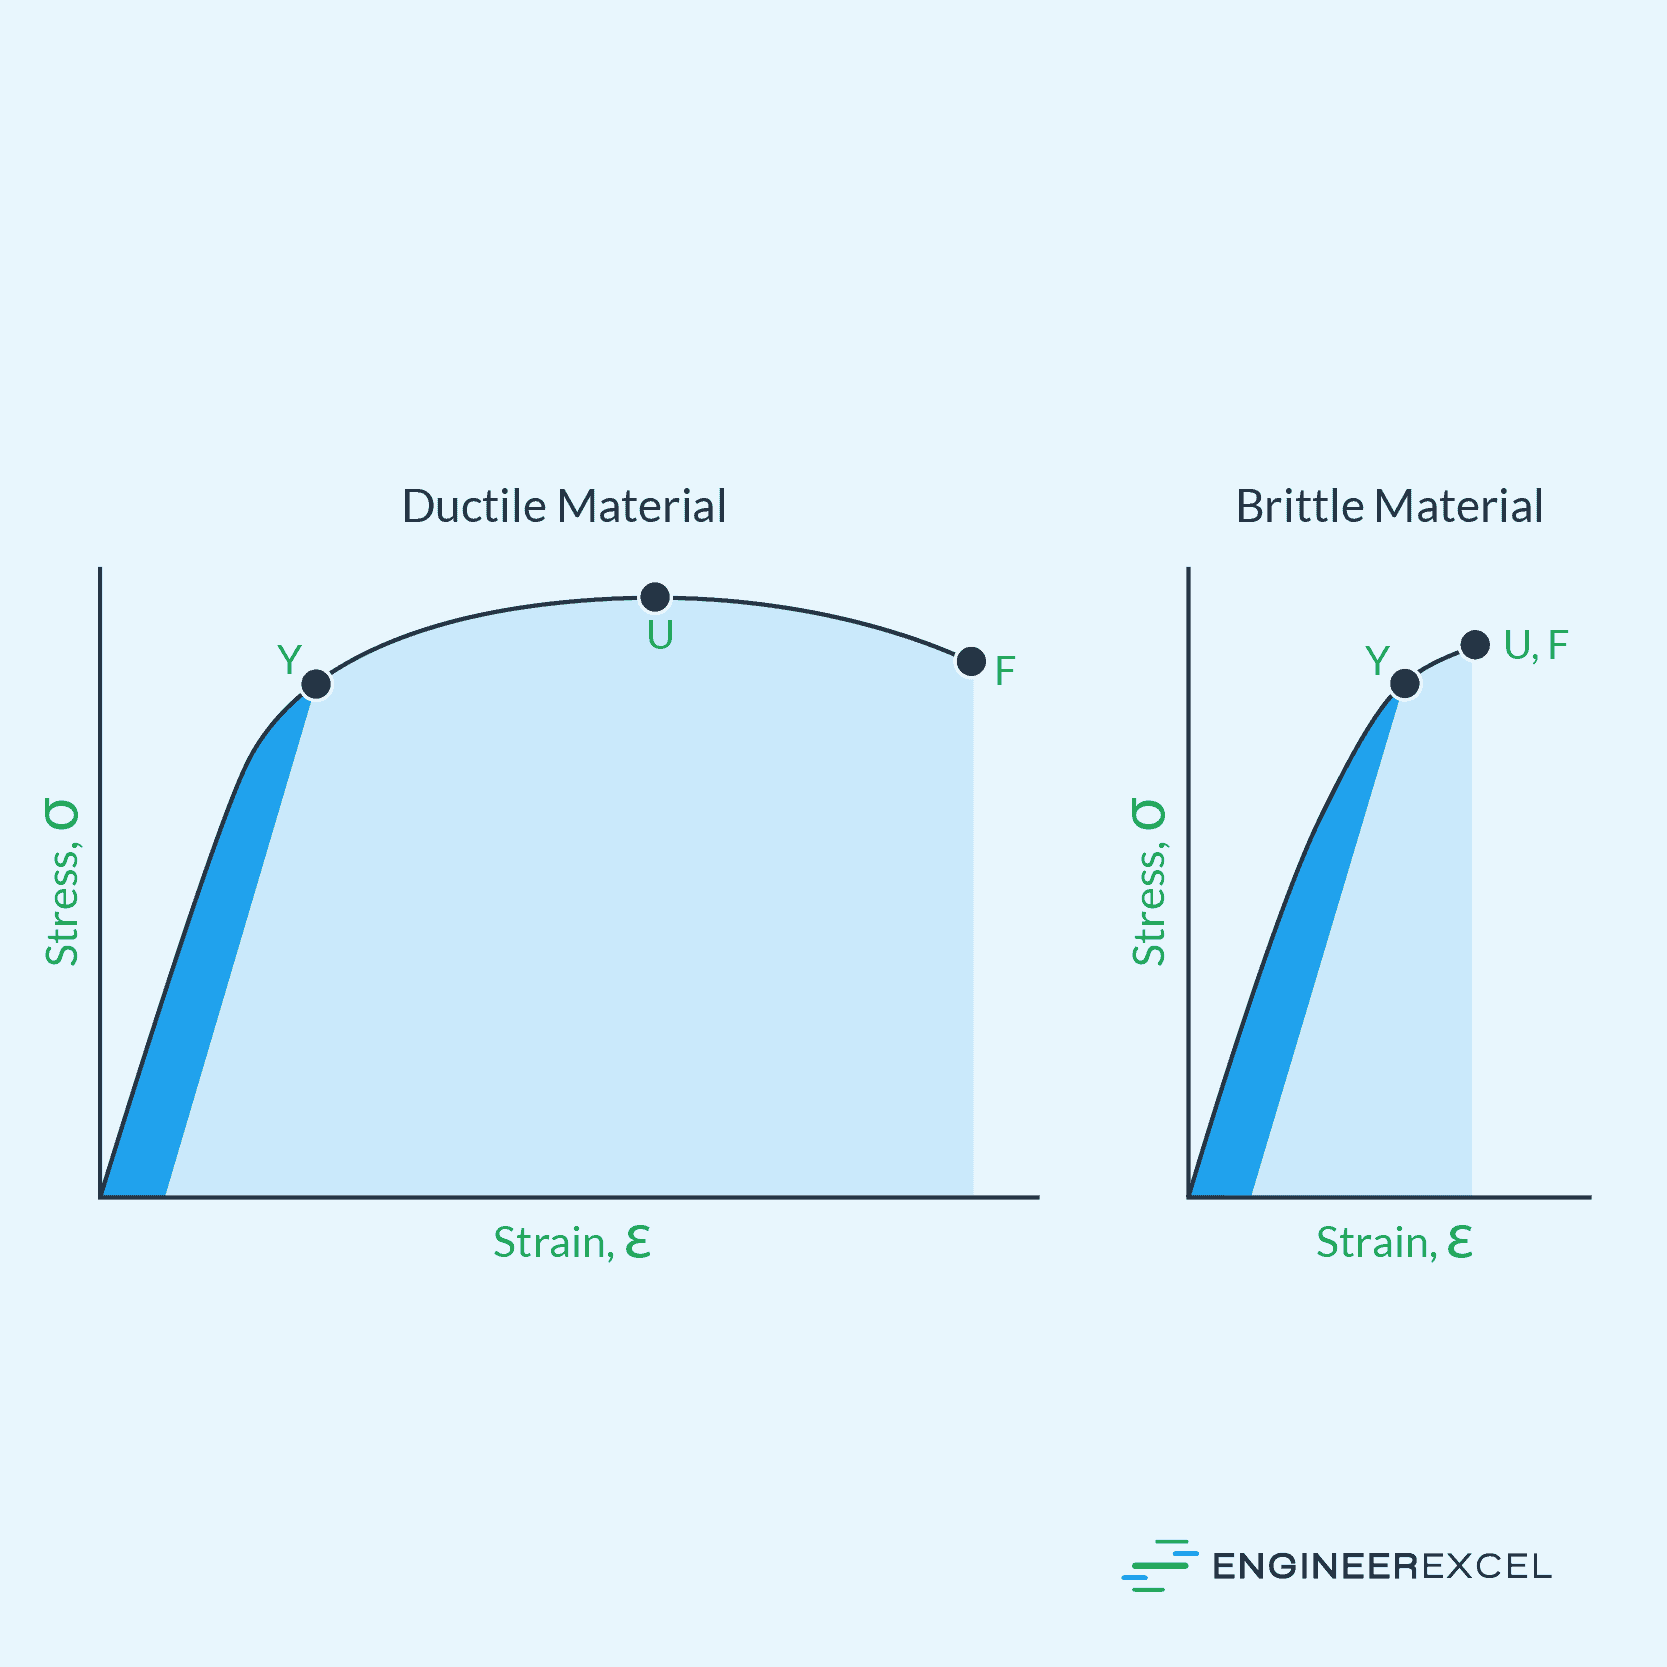
Brittle materials are characterized by a linear elastic response and limited plastic deformation before failure. Examples of brittle materials include ceramics and glasses. Brittle materials show a rapid increase in stress with increasing strain, and typically fail without showing significant signs of deformation.
The stress-strain curve for brittle materials displays a linear relationship between stress and strain in the elastic region. Upon reaching the ultimate strength of the material, failure occurs almost immediately, with little or no plastic deformation before fracture. This behavior makes brittle materials more susceptible to damage under high-stress conditions.
Ductile Materials Response
Ductile materials, on the other hand, are characterized by a more gradual increase in stress with increasing strain, and have the ability to undergo substantial plastic deformation before failure. Examples of ductile materials include metals like steel and aluminum. These materials show significant plastic deformation, allowing them to absorb more energy before failure.
The stress-strain curve for ductile materials starts with a linear elastic region, followed by the yield point, where plastic deformation begins. Beyond the yield point, the material deforms while still supporting a constant stress level called the flow stress. Finally, the curve reaches the ultimate strength of the material, where a necking phenomenon occurs, leading to a drop in stress and eventual failure.
Applications of the Stress-Strain Diagram
One primary application of stress-strain diagrams is in the field of material selection. Engineers often need to choose the most suitable material to satisfy specific design requirements, such as strength, ductility, and toughness. By analyzing the stress-strain curve, they can identify materials with the desired characteristics. For instance, a material with a high Young’s modulus indicates higher stiffness, while the area under the stress-strain curve signifies the material’s toughness1.

In structural design, stress-strain diagrams help engineers calculate the required dimensions and predict potential deformations of structural elements under load. From the diagram, they can determine elastic and plastic deformation regions, ensuring that the material’s deformation remains within its elastic range for long-term performance. Moreover, the stress-strain curve also provides critical information about a material’s yield strength and ultimate strength, which aids engineers in designing safe structures that can withstand anticipated loads2.
Failure analysis is another essential application of stress-strain diagrams. These curves provide valuable insight into the fracture mechanics and failure modes of different materials. By investigating the stress-strain behavior of a material, it becomes easier to identify the root causes of failures. For example, brittle materials tend to fail suddenly without much deformation, while ductile materials exhibit a gradual failure process. By comparing the stress-strain curve of a failed component to that of a healthy one, engineers can deduce if the failure is due to material defects, manufacturing flaws, or overloading3.
- Interpretation of Stress-Strain Diagrams
The stress-strain diagram is a graphical representation of the relationship between the applied stress and the resulting strain in a material. It provides valuable insight into the mechanical behavior of the material, including its strength, ductility, and elastic properties.
The diagram typically starts at the origin, with zero stress and strain. As the stress increases, the material deforms elastically, following a linear relationship known as Hooke’s Law. In this region, the material will return to its original shape upon the removal of stress. The slope of this linear portion is called Young’s Modulus (E), which quantifies the material’s stiffness. The higher the slope, the stiffer the material.
Once the stress reaches a certain point, called the yield strength, the material enters the plastic deformation region. In this stage, the material gets permanently deformed even after stress removal. The stress-strain curve becomes non-linear here, indicating the material’s propensity to undergo plastic deformation under increasing stress. The exact behavior of the curve depends on the material type and processing history.
In ductile materials, such as mild steel, the stress-strain curve will continue to rise in the plastic region until it reaches a maximum value at the ultimate tensile strength. After this point, necking and eventual fracture occur. The diagram for brittle materials, such as cast iron, is different; the curve shows a rapid transition from elastic to the plastic region, and rupture happens with little or no plastic deformation.
Another important parameter derived from the stress-strain diagram is the percent elongation, indicating the material’s ability to stretch before breaking. This parameter helps assess the ductility of a material and its suitability for specific applications.
Common Errors in Understanding Stress-Strain Diagrams
There are several common errors that may arise in the interpretation of stress-strain diagrams.
Misinterpretation of Elastic Modulus: Elastic modulus, also known as Young’s modulus, represents the material stiffness. It is defined as the slope of the initial linear portion of the stress-strain curve. An error could occur when incorrectly assuming that a steeper slope indicates greater material strength. Instead, a steeper slope signifies higher material stiffness. In contrast, the strength of a material is represented by the ultimate stress point or the yield point on the diagram.
Confusion between Engineering and True Stress-Strain Curves: Engineering stress-strain diagrams are commonly used, but it is important to understand that they are based on the original dimensions of a material, whereas true stress-strain diagrams account for the actual deformation of the material during testing. This difference can lead to inaccuracies when comparing material properties. Make sure to use the appropriate diagram and data when evaluating material performance.
Ignoring Shear Stress and Strain: Stress-strain diagrams typically focus on normal stress and strain, but it is important not to overlook the effects of shear stress and strain, especially in materials that show significant shear sensitivity. Shear stress, represented by the tau (τ) symbol, can cause a material to fail under distortion or warping conditions.
Limitations and Challenges in Using a Stress-Strain Diagram
There are some limitations and challenges associated with interpreting and using stress-strain diagrams.
One limitation is the assumption of isotropy, meaning that the material’s properties, such as elastic modulus, shear modulus, and Poisson’s ratio, are independent of its orientation. Real materials often exhibit anisotropic behavior, with different properties depending on the direction of the applied load. In such cases, a single stress-strain diagram may not accurately represent a material’s properties in all orientations. This could lead to inaccurate predictions of material performance when designing and analyzing engineered structures.
Additionally, stress-strain diagrams are typically empirical, which means they are based on testing and measurements performed under specific conditions. The results may not necessarily be applicable to different temperatures, loading rates, or environmental conditions. Moreover, the testing methods and equipment used to generate the diagram may introduce errors that affect the accuracy of the data.
Furthermore, stress-strain diagrams often represent the average behavior of a material, not necessarily capturing local defects or heterogeneities within a sample. Materials with microstructural variations, such as inclusions or grain size differences, may exhibit stress-strain behavior that deviates from the average values. These variations can lead to localized failure or other unexpected behaviors under mechanical loads.
Interpreting stress-strain diagrams also requires an understanding of the different phases and deformation mechanisms that a material undergoes during loading. For example, a ductile metal might exhibit elastic deformation, followed by plastic deformation, work hardening, and finally necking. The different phases and mechanisms can affect the stress-strain relationship and must be carefully considered when using the diagram to make predictions about material performance.
Future Directions in Stress-Strain Diagrams
The field of stress-strain diagrams has experienced continuous advancements in recent years. These improvements have emerged from computational simulations, experimental techniques, and the development of new materials. This section will outline some key areas of focus in this ever-evolving field.
One area deserving attention is the application of advanced computational methods in stress-strain analysis. Machine learning and artificial intelligence algorithms have the potential to analyze vast amounts of data and predict stress-strain behaviors for a wide range of materials. These techniques can lead to greater efficiency in the design and manufacturing processes, as well as improved material performance in various applications. With the growth of computational power, the future will likely see the increased use of these methods in stress-strain analysis.
Moreover, exploring the stress-strain behavior of novel materials is another area of focus. With research into nanomaterials, such as graphene and carbon nanotubes, the understanding of their mechanical properties becomes increasingly important. Advanced experimental methods, such as atomic force microscopy (AFM) and X-ray diffraction (XRD), have been instrumental in investigating these materials’ stress-strain behavior. Developing accurate stress-strain diagrams for these materials is crucial in determining their potential applications and ensuring their reliable usage in innovative applications.
Furthermore, the development of real-time monitoring systems for stress-strain behavior has garnered interest. Sensors and monitoring techniques are being implemented to detect and evaluate stress-strain responses in structures and materials subjected to various loading conditions. This advancement allows engineers to assess the structural integrity and performance of materials through continuous monitoring, enabling them to take timely remedial measures to mitigate potential failures or damages.