
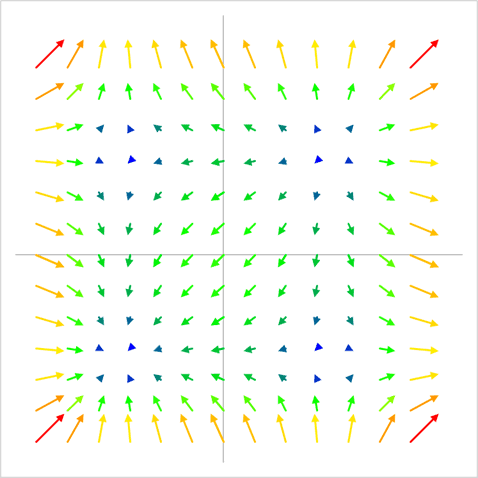
Colored Vector Plot in Excel
In the last blog post, I showed how to use VBA to create a vector plot in Excel. That plot was just a simple black […]
Colored Vector Plot in Excel Read More »
In the last blog post, I showed how to use VBA to create a vector plot in Excel. That plot was just a simple black […]
Colored Vector Plot in Excel Read More »
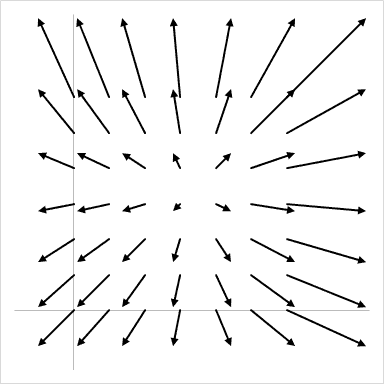
For some time now, I’ve been interested in figuring out how to create a vector plot in Excel. I didn’t really have a need for
Create a Vector Plot in Excel Read More »
Engineers often create charts to visually communicate data. Excel is able to make a number of different types of charts, and there are a lot
How to Quickly Create an XY Chart in Excel Read More »
Formatting charts can take a lot of time, but you can save time by reusing your formatting. We’ll look at how to do this using
Creating and Reusing Custom Chart Styles in Excel Read More »
Importing text data into Excel for analysis is pretty straightforward, but what if you want to use data from a chart in a book or
Converting Graphs to Tables of Data Read More »
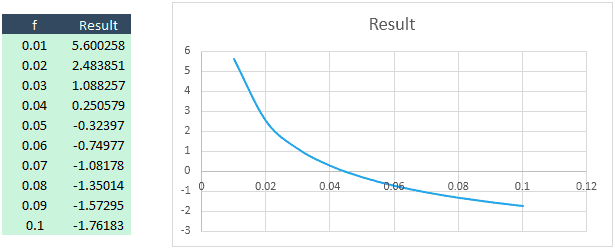
There are several ways to find the roots of equations in Excel. The most basic way is to do so graphically, using a scatter chart.
Finding the Root of an Equation Graphically in Excel Read More »
At some point, you’ll probably need to update a scatter chart in Excel. Perhaps you’ll need to import new data, but in some cases the
3 Ways to Update a Scatter Chart in Excel Read More »
Ever wanted to know how to create a 3 axis graph in Excel? The other day I got a question from Todd, an EngineerExcel.com subscriber.
3 Axis Graph Excel Method: Add a Third Y-Axis Read More »