
With many things we try to do in Excel, there are usually multiple paths to the same outcome. Some paths are better than others depending on the situation. The same holds true for linear regression in Excel. There are four ways you can perform this analysis (without VBA). They are:
- Chart Trendlines
- LINEST function
- “Old School” regression using the Solver
- Linear regression with the Analysis Toolpak Add-In
Each of these linear regression methods has an appropriate time and place. Let’s take a look at each one individually.
Simple Linear Regression with Excel Charts
When you need to get a quick and dirty linear equation fit to a set of data, the best way is to simply create an XY-chart (or “Scatter Chart”) and throw in a quick trendline. Add the equation to the trendline and you have everything you need. You can go from raw data to having the slope and intercept of a best-fit line in 6 clicks (in Excel 2016).
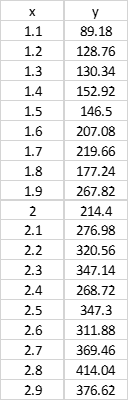
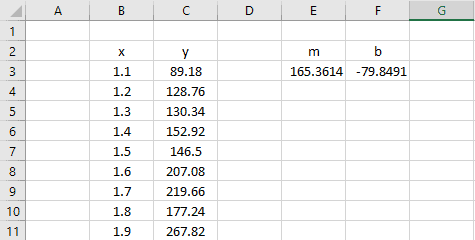
Let’s say we have the data set below, and we want to quickly determine the slope and y-intercept of a best-fit line through it.

Elevate Your Engineering With Excel
Advance in Excel with engineering-focused training that equips you with the skills to streamline projects and accelerate your career.
We’d follow these 6 steps (in Excel 2016):
- Select x- and y- data
- Open Insert Tab
- Select Scatter Chart
- Right-Click Data Series
- Select Add Trendline
- Check Display Equation on Chart
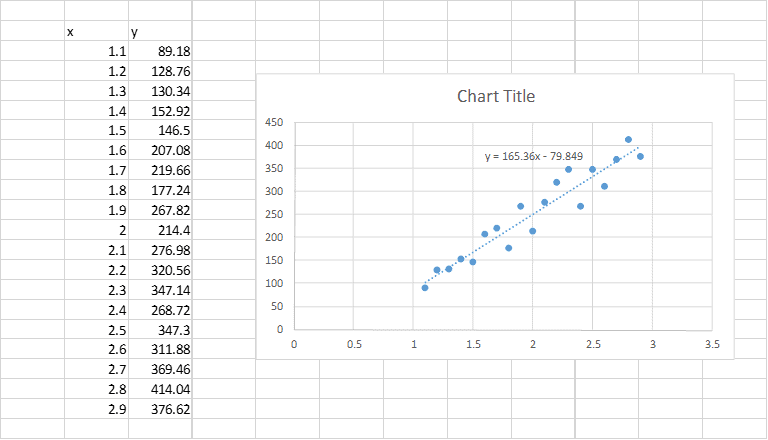
Now we know that the data set shown above has a slope of 165.4 and a y-intercept of -79.85.
Easy, right?
Linear Regression with the LINEST function
The chart trendline method is a quick way to perform a very simple linear regression and fit a curve to a series of data, but it has two significant downfalls.
The first is that the equation displayed on the chart cannot be used anywhere else. It’s essentially “dumb” text.
If you want to use that equation anywhere in your spreadsheet, you have to manually enter it. However, if you change the data set used to obtain the equation, that equation you manually entered will not update, leaving your spreadsheet with an erroneous equation.
The second issue is that sometimes the number of significant digits displayed in the formula on the chart is very limited. In fact, sometimes, you’ll only be able to see one or two significant digits. And that will lead to inaccuracy in the predicted values of y.
What we need for these situations is a function that can perform the same kind of simple linear regression done by the charting utility and output the coefficients to cells where we can use them in an equation. Of course, it also needs to return values with more significant digits.
The LINEST function does this perfectly. Given two sets of data, x and y, it will return the slope (m) and intercept (b) values that complete the equation
y = mx + b
The syntax of the function is as follows:
LINEST(known_y’s, [known_x’s], [const], [stats])
Where:
Known_y’s is the y-data you are attempting to fit
Known_x’s is the x-data you are attempting to fit
Const is a logical value specifying whether the intercept is forced to zero (FALSE) or not (TRUE)
Stats is a logical value that specifies whether regression statistics are returned
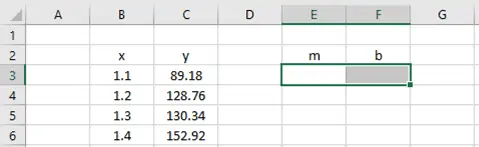
LINEST is an array function, so we need to enter it as an array formula, providing two cells to which it can return the values of m and b.
Let’s take a look at how LINEST could be used to determine the equation of a best-fit line for the data above.
Since LINEST will return two values, I start by selecting two adjacent cells on the worksheet.
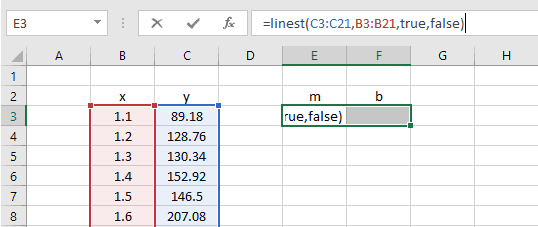
Next, I enter the formula in the formula bar, rather than in the cell.
Finally, because it’s an array formula, I press CTRL+SHIFT+ENTER to calculate the cells.
The results are…
…exactly the same as those provided by the trendline method.
This was obviously more work than using a trendline, but the real advantage here is that the slope and y-intercept values have been output to a cell. That means we can use them dynamically in a calculation somewhere else in the spreadsheet.
Linear Regression Using Solver
This method is more complex than both of the previous methods. Fortunately, it will probably be unnecessary to ever use this method for simple linear regression. I’ve included it here because it provides some understanding into the way that the previous linear regression methods work. It will also introduce you to the possibilities for more complicated curve fitting using Excel.
- Enter “guess-values” for the slope and intercept of the equation
- Calculate new y-values based on those guess values
- Calculate the error between the calculated y-values and the y-data
- Use the Solver to find values of the slope and intercept that minimize the total error
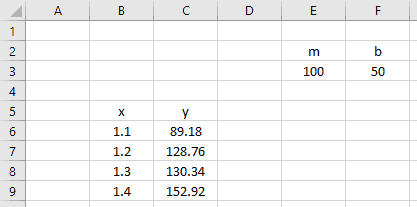
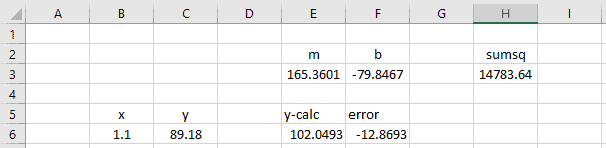
Let’s start again with the x- and y- data we had before.
Next, enter some guess values for m and b into some cells on the worksheet.
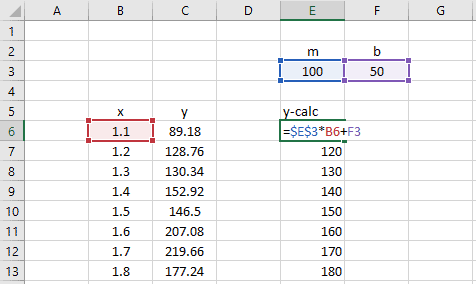
Now create a new column of calculated y-values based on the m and b guess values and the known x-data.
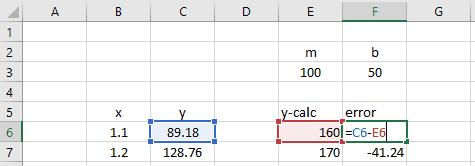
Next, create an error column, calculating the difference between the y-data and calculated y-values.
Finally, create a new formula, calculating the sum of squares of the error column.
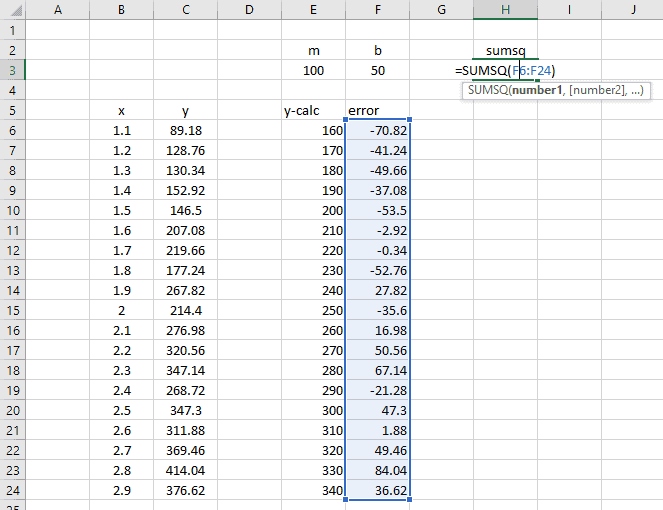
We will use the Solver to minimize this value – the sum of the squared errors. The reason why we use “sum of squares” instead of just “sum” is because we do not want an error of -100 in one cell to cancel out an error of 100 in another cell. We want each value in the error column to be driven to its minimum absolute value.
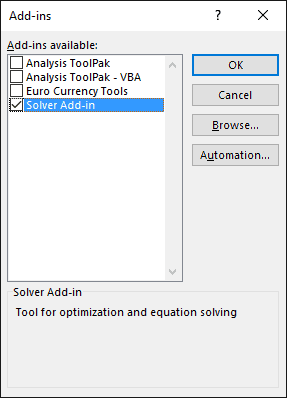
Now, let’s open up the Solver. If you have never used the Solver Add-In before, you must first enable it. Follow the steps here to enable the Solver.
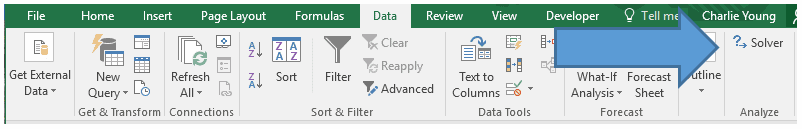
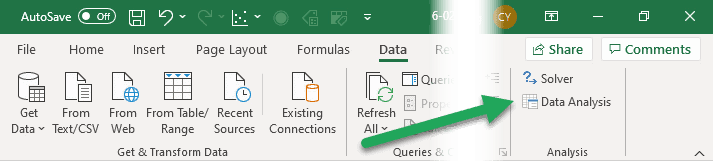
After the Add-In has been loaded, you can open the Solver from the Data tab. You’ll find it way over on the right side of the ribbon:
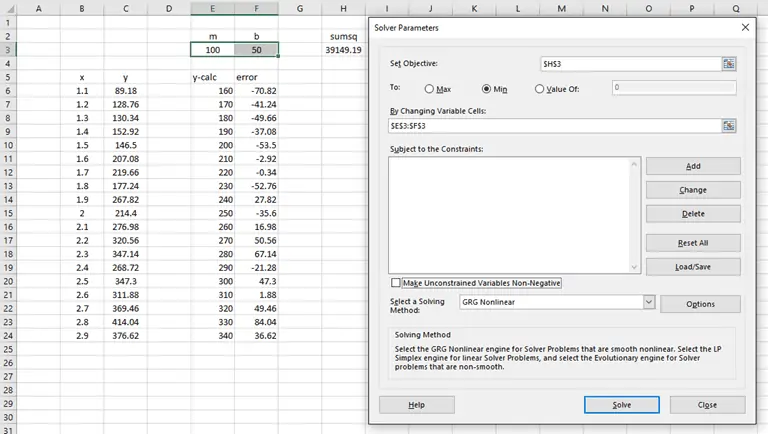
With the Solver open, the setup for this is pretty straightforward.
- We want to minimize the objective, cell H3, or the sum of the squared errors.
- To do so, we will change variable cells E3 and F3, the slope and y-intercept of our linear equation.
- As a last step, uncheck the option to “Make Unconstrained Variables Non-Negative”.
When properly set up, the solver dialog should look like this:
When we click “Solve”, the Solver does its thing and finds that the values m = 165.36 and b = -79.85 define the best-fit line through the data. Exactly what was predicted by the chart trendline and LINEST.
Of course, this is totally expected. After all, we have just done “manually” what the Trendline tool and LINEST do automatically.
In the case of a simple linear regression like we have here, Solver is probably complete overkill. However, this is just the start. We can use this same concept to do more complex multiple linear regression or non-linear regression analysis in Excel. Using Solver, you can fit whatever kind of equation you can dream up to any set of data. But that’s a topic for a completely different post.
Regression Analysis in Excel with the Analysis Toolpak Add-In
The final method for performing linear regression in Excel is to use the Analysis Toolpak add-in. This add-in enables Excel to perform difficult statistical analysis, but it is not enabled by default in Excel installations.
Install the Analysis Toolpak Add-In
To enable the Analysis Toolpak, follow these steps:
- Open the File tab, then select Options in the lower left corner
- Click Add-Ins in the lower left of the Excel Options window
- In the Manage drop-down, select “Excel Add-Ins”
- Click Go
- Select Analysis Toolpak
- Click OK
The Analysis Toolpak will be available in the Data tab in the Analysis group (on the far right of the ribbon and next to Solver). It is labelled as “Data Analysis”.
Simple Linear Regression Analysis with the Analysis Toolpak
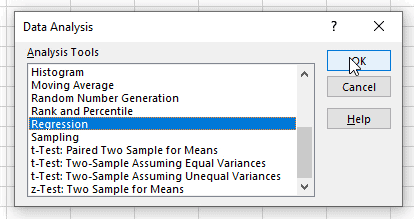
Open the Analsis Toolpak Add-In from the ribbon and scroll down until you see Regression. Select it and click OK.
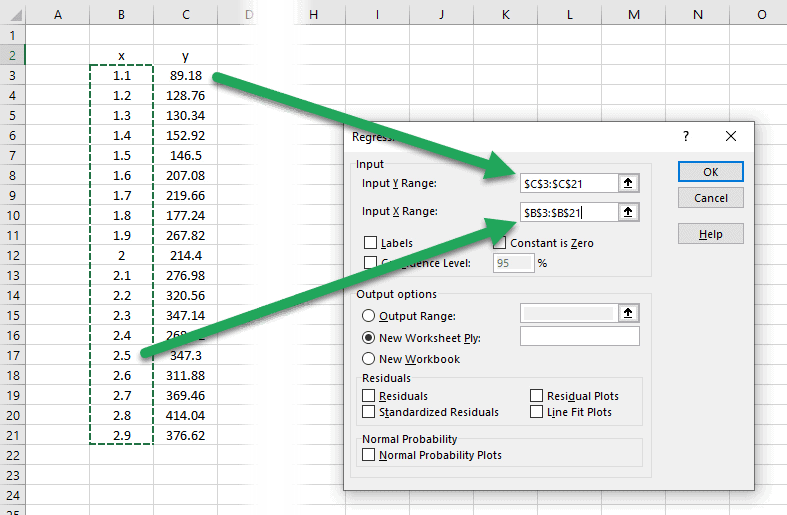
When the regression window opens, you’ll be greeted by tons of options. We’ll cover those in a minute, but let’s just keep it simple for now.
First, place the cursor in the box for “Input Y Range”, and select the y-values or dependent variables.
Repeat this for the “Input X Range”.
We can choose to set the intercept, or constant, to zero. If this box is unchecked, the constant will be calculated similarly to our previous regression analyses.
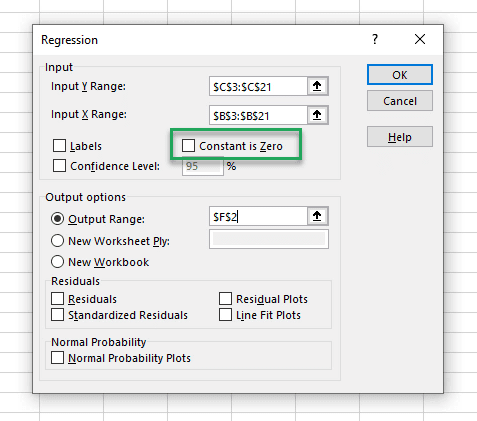
Next, select where the output data should be stored. The regression tool generates a large table of statistics, so you may want to store them on a new worksheet. Or you can specify a specific output range cell on the current worksheet. This cell will become the upper right cell in the output table. In the example below, I chose cell F2.
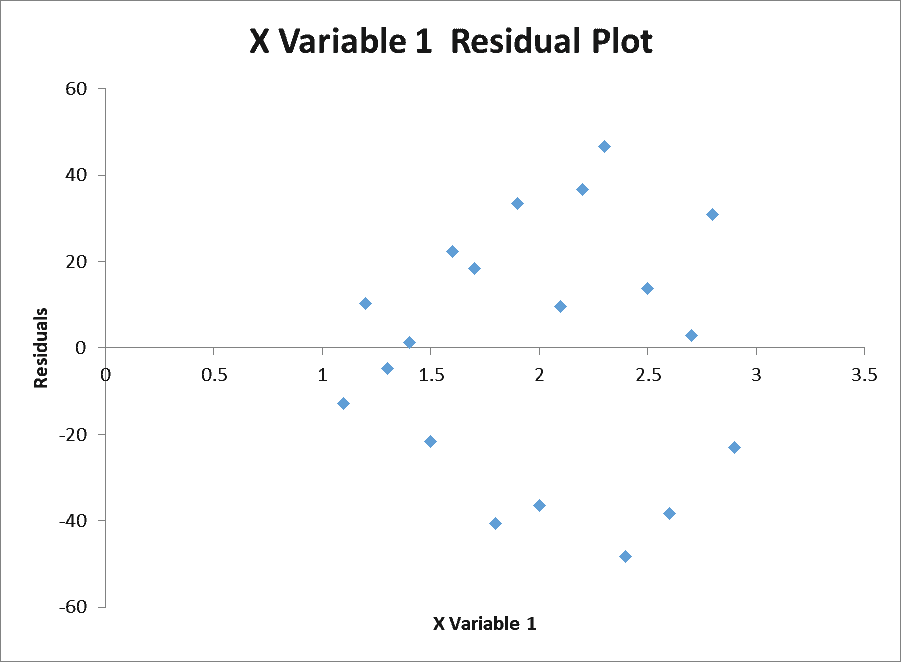
Finally, the regression tool provides several options for examining the residuals. Residuals are the difference between the observed y-values and the predicted y-values. Generally, the residuals should be randomly distributed with no obvious trends, such as increasing or decreasing in value as the x-values increase.
To examine for this easily, we can choose to create a residual plot with the regression analysis by checking the box next to “Residual Plots”.
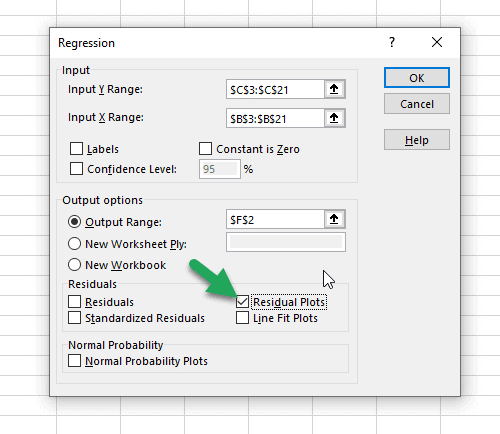
Finally, with everything set up, all that is left to do is click the OK button to generate the report.
This is what it should look like:
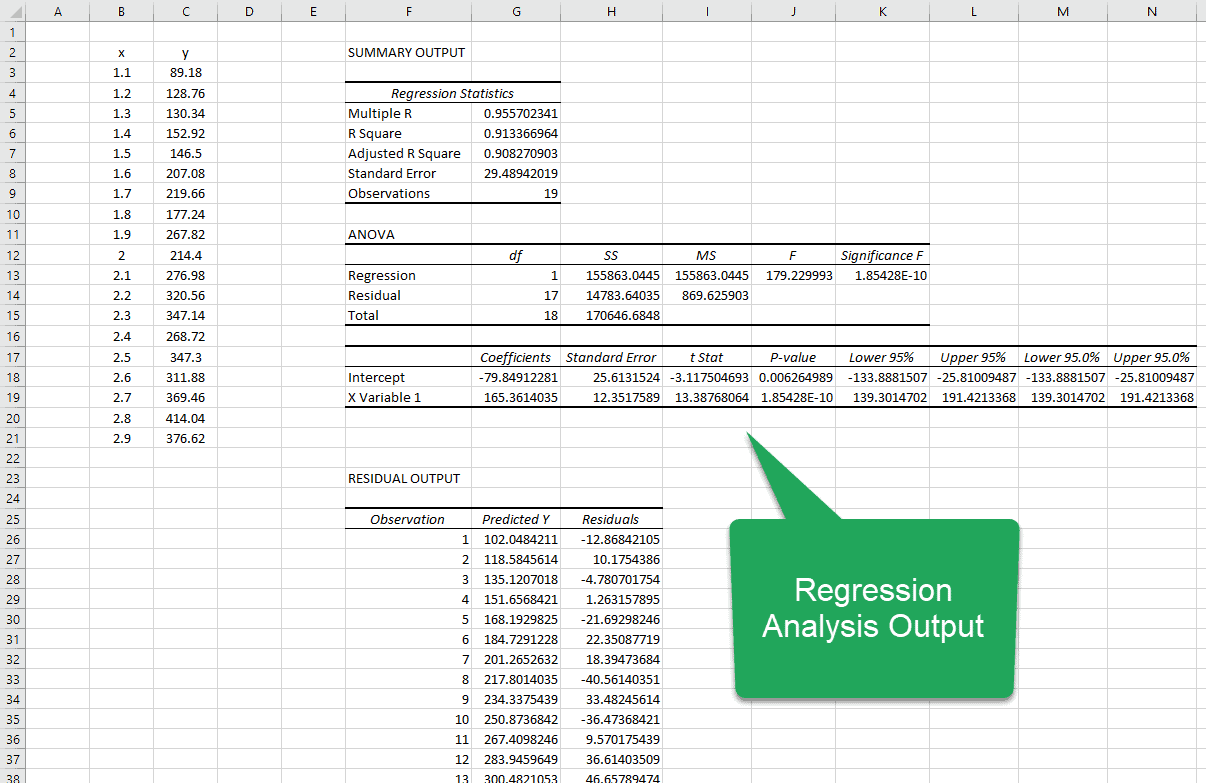
If you are looking for the coefficients that describe the best-fit line, you’ll have to go all the way down into the third table in the report. Here, you’ll see two rows:
- Intercept
- X Variable 1
The column in this table labeled “Coefficients” contains the values of the intercept and slope (X Variable 1). You can see that they match the values we obtained using the other methods. (Which is always nice to see!)
The plot of residuals is random, and there are no trends in the residuals:
The regression tool generates a lot of other data as well, so let’s look at some of the more important details:
Linear Regression Statistics
The first table in the report contains the Regression Statistics. These statistics are important because they tell us how well the line that results from the linear regression analysis fits the observed data.
Multiple R: This is the Pearson correlation coefficient that describes the correlation between the predicted values of Y and the observed values of Y. A value of 1 means that there is a perfect correlation between the two, and a value of 0 means that there is no correlation at all. In this analysis the value is 0.96, so there is a very strong correlation between the predicted and observed y-values.
R-Square: This is the coefficient of determination and it explains how much of the variation in the dependent variable can be explained by the equation. In this case, the R-Squared value is 0.91, so 91% of the variation is captured by the equation. That means the other 9% of the variation is not explained by the equation. It may be due to randomness or measurement error, for example.
Adjusted R-Square: This term is used for multiple linear regression and is useful in determining if a new term added to the model has helped to improve the prediction capability of the model or not. If an added term improves the model, this value increases. If an added term does not improve the model, this value decreases.
Standard Error: This is an estimate of how far the observed values are from the line that results from the regression analysis.
Observations: This is simply the number of observed data points.
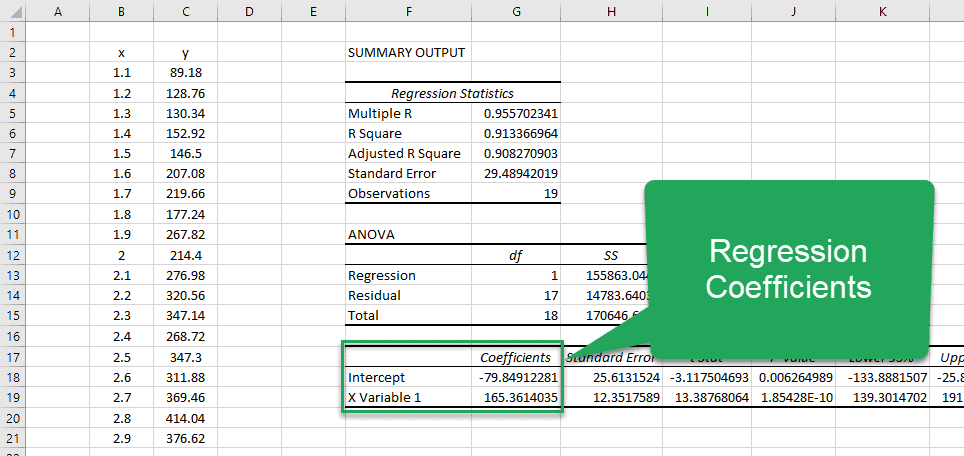
Regression Coefficients
This is the third table in the report that contains a row for each of the coefficients and several columns:
- Coefficients
- Standard Error
- t Stat
- P-value
- Lower 95%
- Upper 95%
Coefficients: These are the coefficients on the variables that describe the line of best fit. In this example, we would assemble the coefficients into the equation:
Standard Error: This value tells us how much the observed values deviate from the best-fit line.
t Stat: This is the value you would use in a t-test.
P-value: This is the P-value used for the hypothesis test. If the P-value is low, we reject the null hypothesis.
Lower 95%: This is the lower bound of the 95% confidence interval.
Upper 95%: This is the upper bound of the 95% confidence interval.
Residual Output
The final table in the report lists the predicted value of y and the residual, or error between the predicted and observed value, for each value of x.
Regression Analysis Options
Performing a basic linear regression analysis with the Analysis Toolpak is straightforward, but there are many options to really expand its capability.
Labels: By selecting this option, the regression tool will use the cell value in the top row of the x-values as a label for the x-values.
Confidence Level: It’s possible to set a different confidence level in this field. The default is 95%.
Residuals: Choosing this option will add the residuals to the output table.
Standardized Residuals: When this option is selected, standardized residuals will be written to the worksheet.
Line Fit Plots: This will create a plot that includes the original observations and the predicted y-values. It is like adding a trendline to a plot.
Normal Probability Plot: This will plot the data against a normal distribution, which helps to determine whether the data is normally distributed.