
In engineering, you’ll encounter data than doesn’t follow a linear trend. In those cases, you’ll need to use nonlinear methods. Excel has a few different options for fitting these curves.
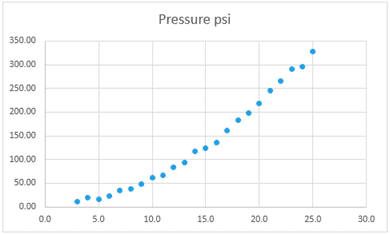
The worksheet contains pressure and flow data for a valve in a piping system. Select the data and create an XY scatter chart. You’ll see that the data is non-linear:
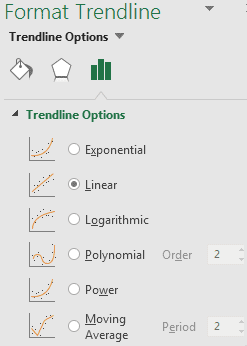
Excel is able to add trendlines to non-linear curves. Right-click the data series and select Add Trendline. The Format Trendline task pane will open:
The default trendline uses a linear equation, but there are several other options. If you aren’t sure what equation fits the data best, you can click through the equation types to find the right one.

Elevate Your Engineering With Excel
Advance in Excel with engineering-focused training that equips you with the skills to streamline projects and accelerate your career.
Before doing that, scroll down in the task pane and select Display Equation on Chart. This way you can see the equation of the lines that each fit uses. Also check the box beside Display R-squared value on the chart.
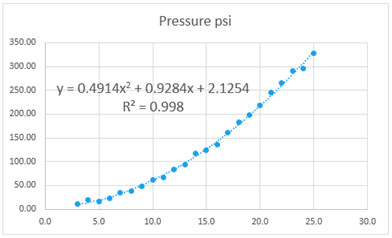
Click through each of the trendline options. You’ll find that exponential, linear, and logarithmic are visibly poor fits. The polynomial and power trendlines are better fits. The polynomial trendline fits the curve to the general equation y = ax2 + bx + c. Excel will give you values for the coefficients a, b and c:
The power trendline fits the data to the equation y = axb, outputting values for a and b. It’s also a fairly good fit:
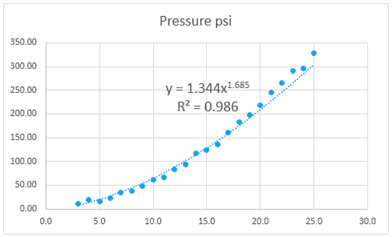
However, you may be able to guess from looking at the trendlines that the polynomial equation fits the data slightly better. This is confirmed by examining the R2 values (0.998 for the polynomial fit versus 0.986 for the power fit).
The trendline tool in Excel will calculate polynomials up to sixth order. You can increase the order of the polynomial using the box beside the polynomial option. However, in this case, a higher order doesn’t have much effect, if any, on the R2 value, so stick with the second order polynomial.
The governing equation for pressure drop through an orifice involves a squared term, so fitting to a second-order polynomial equation makes logical sense.
Be careful about using high order polynomials if you have limited data points. For example, if you have only five data points, don’t select a fourth order polynomial. It will fit the data exactly, but won’t tell you much about the general trend of the data. It’ll also be inaccurate outside of the bounds of the data that you used as inputs.