
Create a Vector Plot in Excel
For some time now, I’ve been interested in figuring out how to create a vector plot in Excel. I didn’t really have a need for […]
Create a Vector Plot in Excel Read More »

For some time now, I’ve been interested in figuring out how to create a vector plot in Excel. I didn’t really have a need for […]
Create a Vector Plot in Excel Read More »
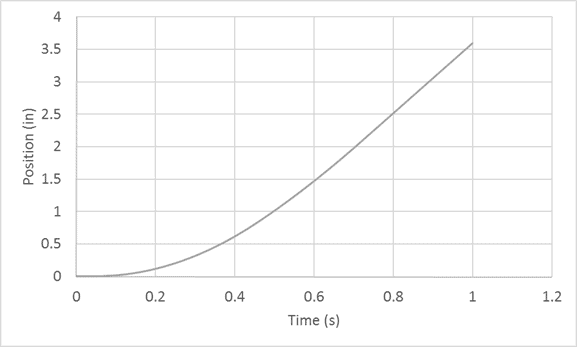
There are two primary ways to perform numerical integration in Excel: 1. Integration in Excel via the Spreadsheet This type of numerical integration is largely
Numerical Integration in Excel Read More »

To perform linear interpolation in Excel, use the FORECAST function to interpolate between two pairs of x- and y-values directly. In the example below, the
Linear Interpolation in Excel Read More »
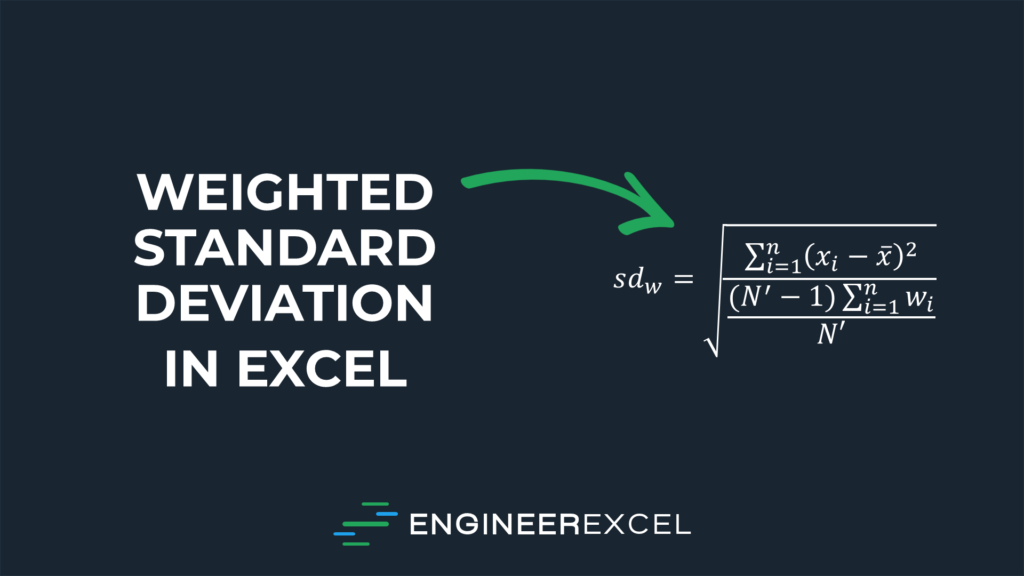
In this post, you’ll learn how to calculate a weighted standard deviation in Excel. A weighted standard deviation calculates the spread in a data set
Weighted Standard Deviation in Excel Read More »
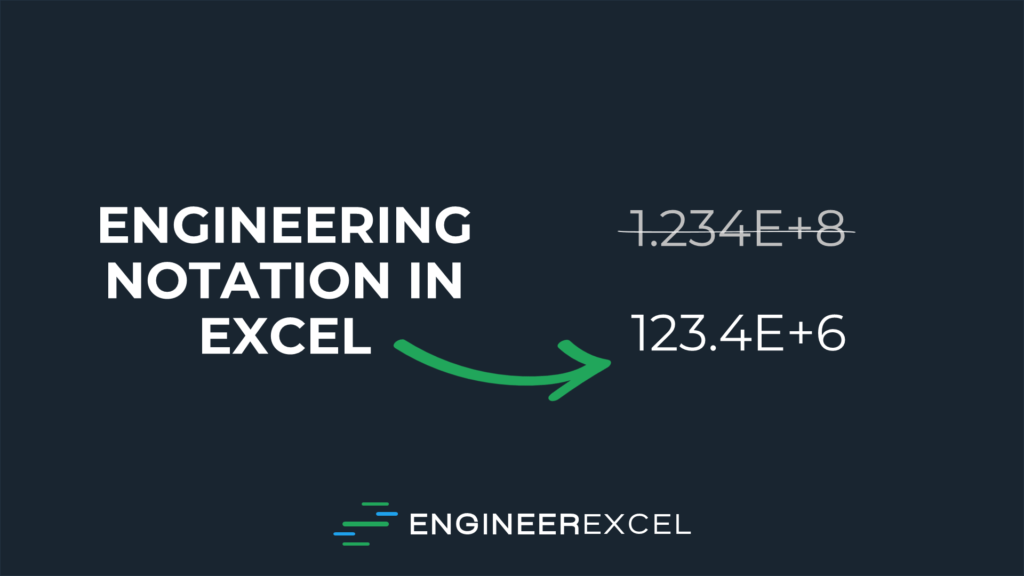
In this post, you’ll learn how to display numbers in Excel using engineering notation, how engineering notation differs from scientific notation, and how custom formats
Engineering Notation in Excel Read More »
In this post, you’ll learn how to create a catenary cable tension calculator in Excel by solving an implicit equation. The example will show specifically
Catenary Cable Tension Calculator in Excel Read More »
In this post, you’ll learn how to create custom Excel functions to store engineering constants by creating a user-defined function in VBA that can store
Custom Excel Functions for Engineering Constants Read More »
Excel’s Solver add-in can be used to find the best-fit line for nonlinear data. Worksheet 07f contains the flow and pressure data that was used
Using Excel Solver for Nonlinear Regression Read More »