
Excel’s Solver add-in can be used to find the best-fit line for nonlinear data. Worksheet 07f contains the flow and pressure data that was used in a previous example to illustrate fitting with LINEST.
Delete the coefficients that are in the table from that example. For Solver to work, you’ll need to enter guess values for each coefficient, so enter 1 in all three cells. The chart will update the curve with your guess values, but it’s not a good fit. We’ll use Solver to find the optimum values for each coefficient to define a best-fit curve.
The worksheet already has columns for measured flow, measured pressure, and calculated pressure. As before, you’ll use Solver to do a least-squares fit, so you’ll also need a column for error. Insert a column beside the Pcalc column and label it Error. In the first cell of this column, calculate the difference between the calculated value and the measured value:
=D7-C7
Double-click the fill-handle to complete the column.
Recall that the Solver needs a single cell to minimize. Add a row below the coefficients for the overall error. Enter the formula:

Elevate Your Engineering With Excel
Advance in Excel with engineering-focused training that equips you with the skills to streamline projects and accelerate your career.
=SUMSQ(E7:E29)
The SUMSQ function will sum the squares of all the error values. We’ll use Solver to minimize this cell. Go to the Data tab and choose Solver. Set the objective to the cell containing the overall error. Click the button beside Min to minimize this cell.
You can minimize the error by changing all three coefficients simultaneously. In the box for the variable cells, select the three coefficients (currently all set to 1). No constraints are needed. Leave the algorithm set to GRG Nonlinear and click Solve.
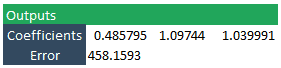
The coefficients that Solver found are not the same as those that LINEST found. That’s because GRG Nonlinear can give different results based on the initial guess values. Since we used guess values of 1, Solver found a local minimum near those values. This wouldn’t be obvious if you were using the Solver method alone and hadn’t seen the LINEST results.
However, the coefficients Solver found are close to the LINEST results, and they give a good fit to the measured data:
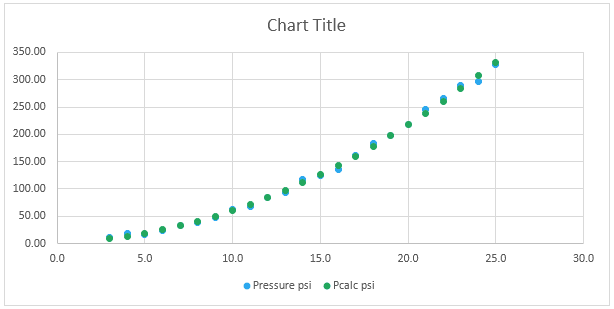
The curve from the Solver fit can be used to accurately represent the measured data in subsequent calculations as necessary.