
There are two primary ways to perform numerical integration in Excel:
- Integration in Excel via the Spreadsheet
- Integration using VBA
1. Integration in Excel via the Spreadsheet
This type of numerical integration is largely reserved for experimental data.
It is useful for when you want to see how some integral of the experimental data progresses over time.
2. Excel Integration using VBA

Elevate Your Engineering With Excel
Advance in Excel with engineering-focused training that equips you with the skills to streamline projects and accelerate your career.
This method works best when you want to integrate an equation with a larger number of integration points and only want to return a single value.
It can be set up with a user defined function (UDF).
Integrals in Excel: Calculation Methods
Whether you choose to integrate tabular data in the spreadsheet or an equation in VBA, there are two general approximations that are used to estimate the area under the curve.
They are the Midpoint (or Endpoint) Rule and the Trapezoidal rule.
Midpoint Rule in Excel
The midpoint rule estimates the area under the curve as a series of pure rectangles (centered on the data point).
As you can imagine, this results in poor accuracy when the integrand is changing rapidly.
It’s best not to use this method if the number of integration points is limited.
Trapezoidal Rule in Excel
The trapezoidal rule estimates the area under the curve as a series of trapezoids.
This greatly increases the accuracy, regardless of the change in the integrand.
As the number of integration points increase, the results from these methods will converge.
How to Integrate in Excel: Example Problem
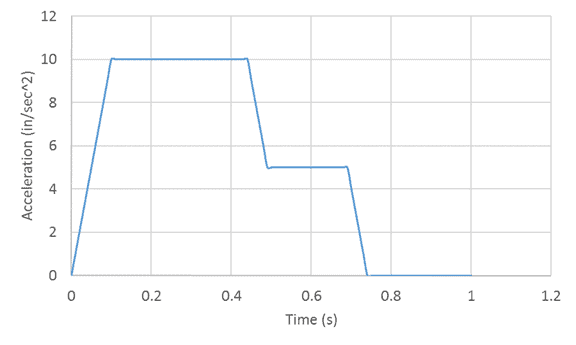
We are given a table of acceleration data and asked to estimate the velocity and position over time. The acceleration as a function of time is as follows:
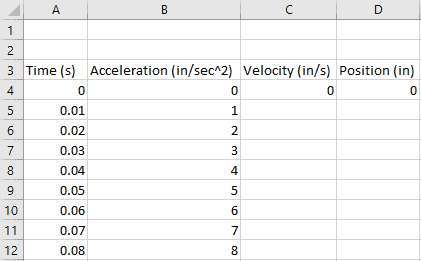
To start with, let’s add some columns for Velocity and Position to our data and also fill in the initial values.
We can assume that the object being accelerated here is starting at rest, so it’s velocity and position are “0” at time t=0.
Integrate in Excel to Calculate Velocity from Acceleration Data
Next, we can calculate the velocity. We know that, in general, velocity is related to acceleration by the following equation:
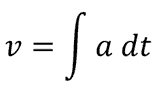
So, to calculate the velocity at any given time, we need to calculate the integral of acceleration through time.
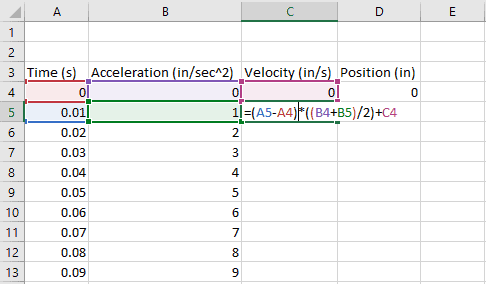
Since we have a finite number of data points the trapezoidal method will give us the greatest accuracy, so let’s use that.
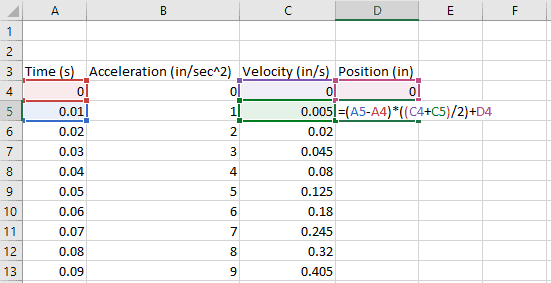
In cell C5 (the first velocity value after the initial velocity, 0, we entered above), enter the formula to calculate the trapezoidal area under the curve.
=(A5-A4)*((B4+B5)/2)+C4
Filling that formula all the way down gives us the following velocity result:
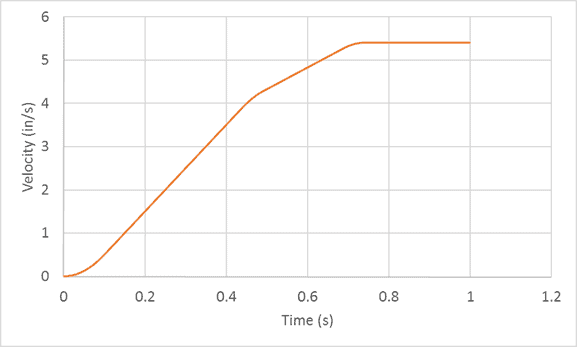
The velocity result makes sense given the acceleration data. We have a region of progressively increasing velocity from 0-0.1 seconds. Increasing velocity at different rates from 0.1 to ~0.45 seconds and ~0.45 to 0.7 seconds. And constant velocity (zero acceleration) from 0.7 to 1 seconds.
Excel Integration to Calculate Position from Velocity
Now we can move on to the position data.
We will enter the same formula for trapezoidal area under the velocity curve to calculate position:
=(A5-A4)*((C4+C5)/2)+D4
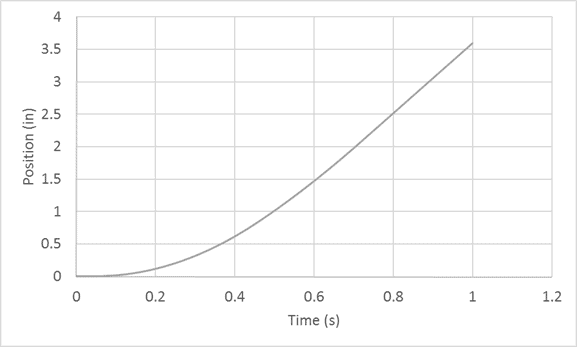
Once again, we fill that equation all the way down to obtain position as a function of time:
Conclusion
This method for performing numerical integration in Excel can be applied to many different problems. Hopefully this post has given you what you need to get started applying this technique to your own work.