
Shear stress is the force that acts parallel to a surface, causing one layer of a material to slide or deform relative to an adjacent layer. In beam analysis, understanding the distribution of shear stress is important for assessing structural stability and integrity, as it helps identify potential weak points and areas prone to failure. In this article, we will analyze shear stress distribution for different beam geometries.
What is Shear Stress
Before learning about shear stress distribution, it is important to first understand the concept of shear stress.
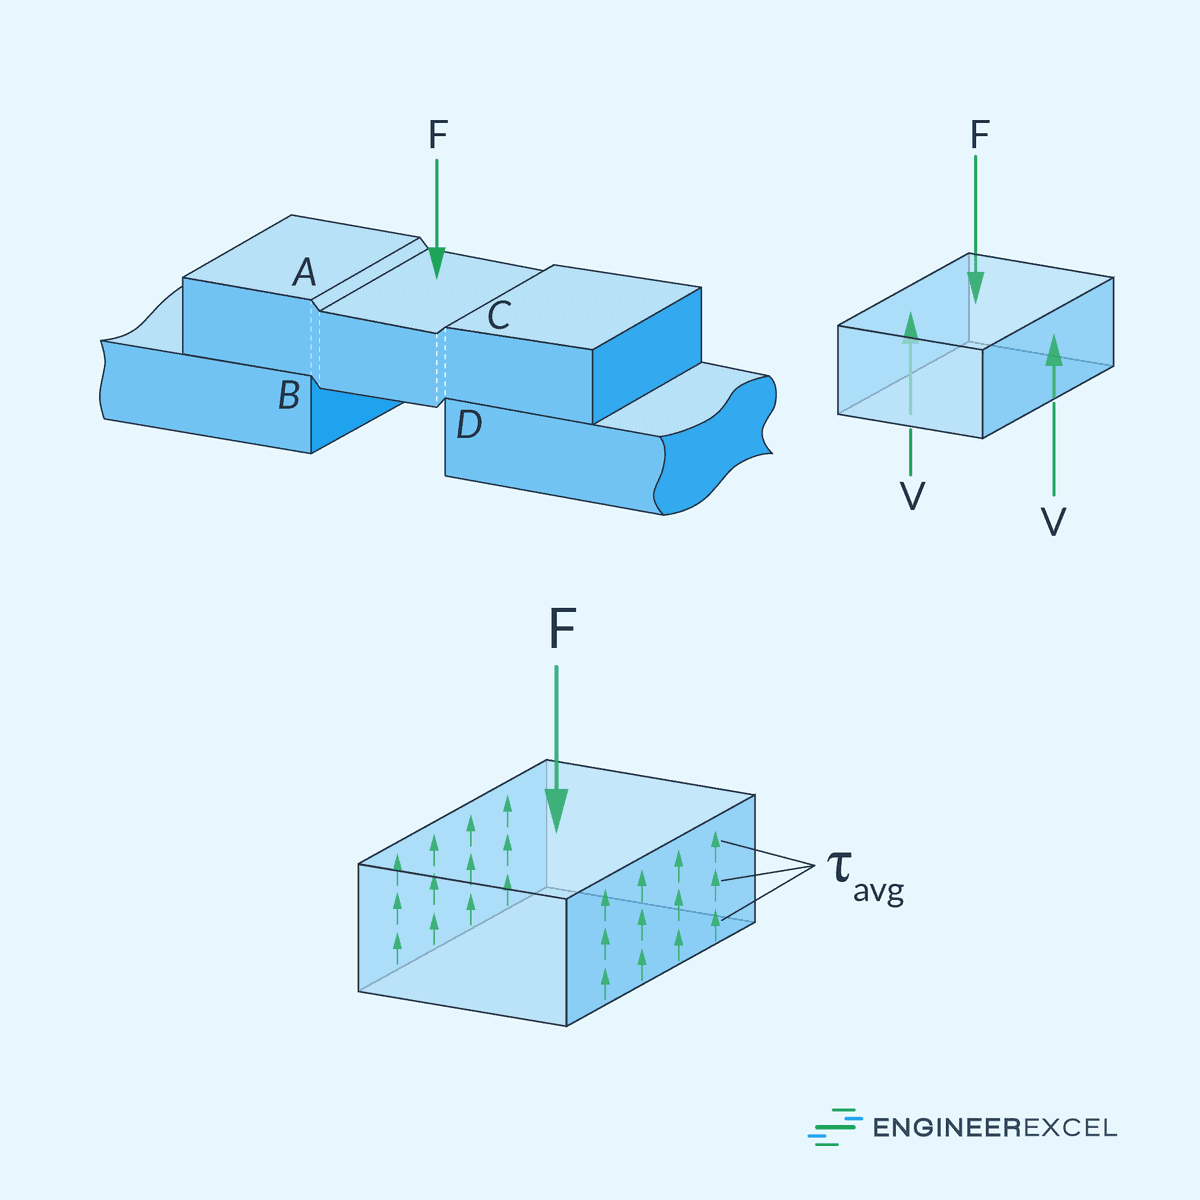
In beam analysis, shear stress refers to the intensity of the force acting tangent to the cross-section of a beam. When a beam is subjected to transverse loads, such as the one shown in the diagram below, internal shear forces develop within the beam. These internal shear forces create shear stress on the cross-section of the beam.

Elevate Your Engineering With Excel
Advance in Excel with engineering-focused training that equips you with the skills to streamline projects and accelerate your career.
Mathematically, the average shear stress can be calculated using the formula:
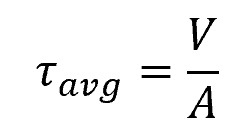
Where:
- τavg = shear stress [Pa]
- V = internal shear force within the beam [N]
- A = cross-sectional area over which the shear force is distributed [m2]
Shear Stress Distribution
The formula above assumes a uniform distribution of average shear stress across the cross-sectional area. However, in reality, the distribution of shear stress varies throughout the depth of the cross-section. In engineering practice, a more precise equation describing the distribution of shear stress in a beam’s cross-section is provided by the shear formula:
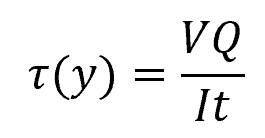
Where:
- τ(y) = shear stress at distance y from the neutral axis [Pa]
- V = internal shear force [N]
- Q = first moment of area above (or below) the segment of interest and the neutral axis [m3]
- I = moment of inertia of the entire cross-section [m4]
- t = width of the segment of interest [m]
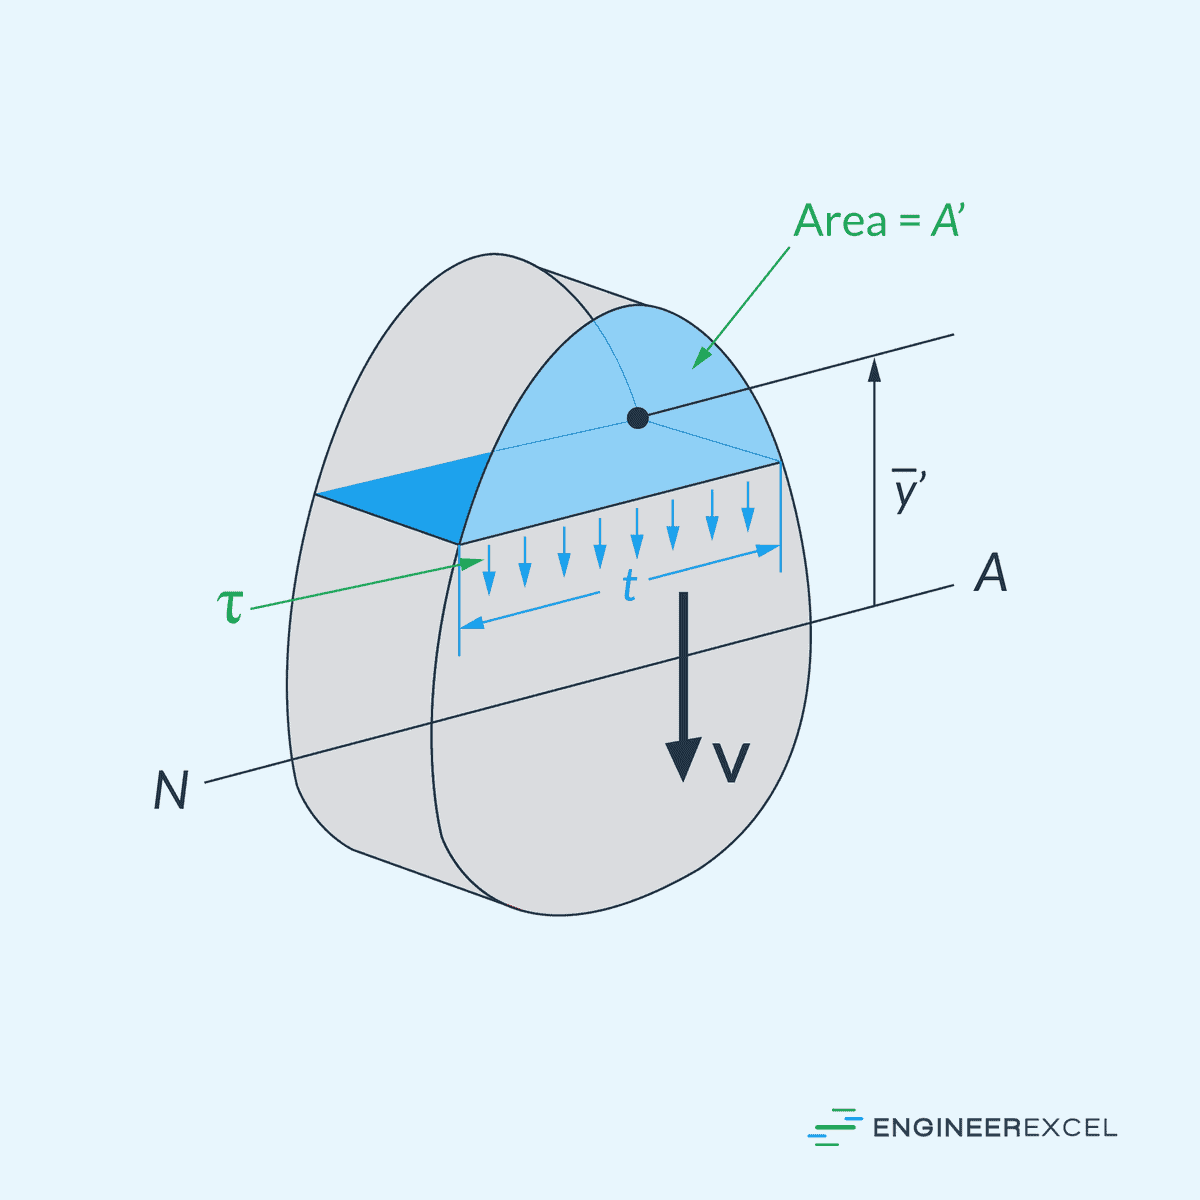
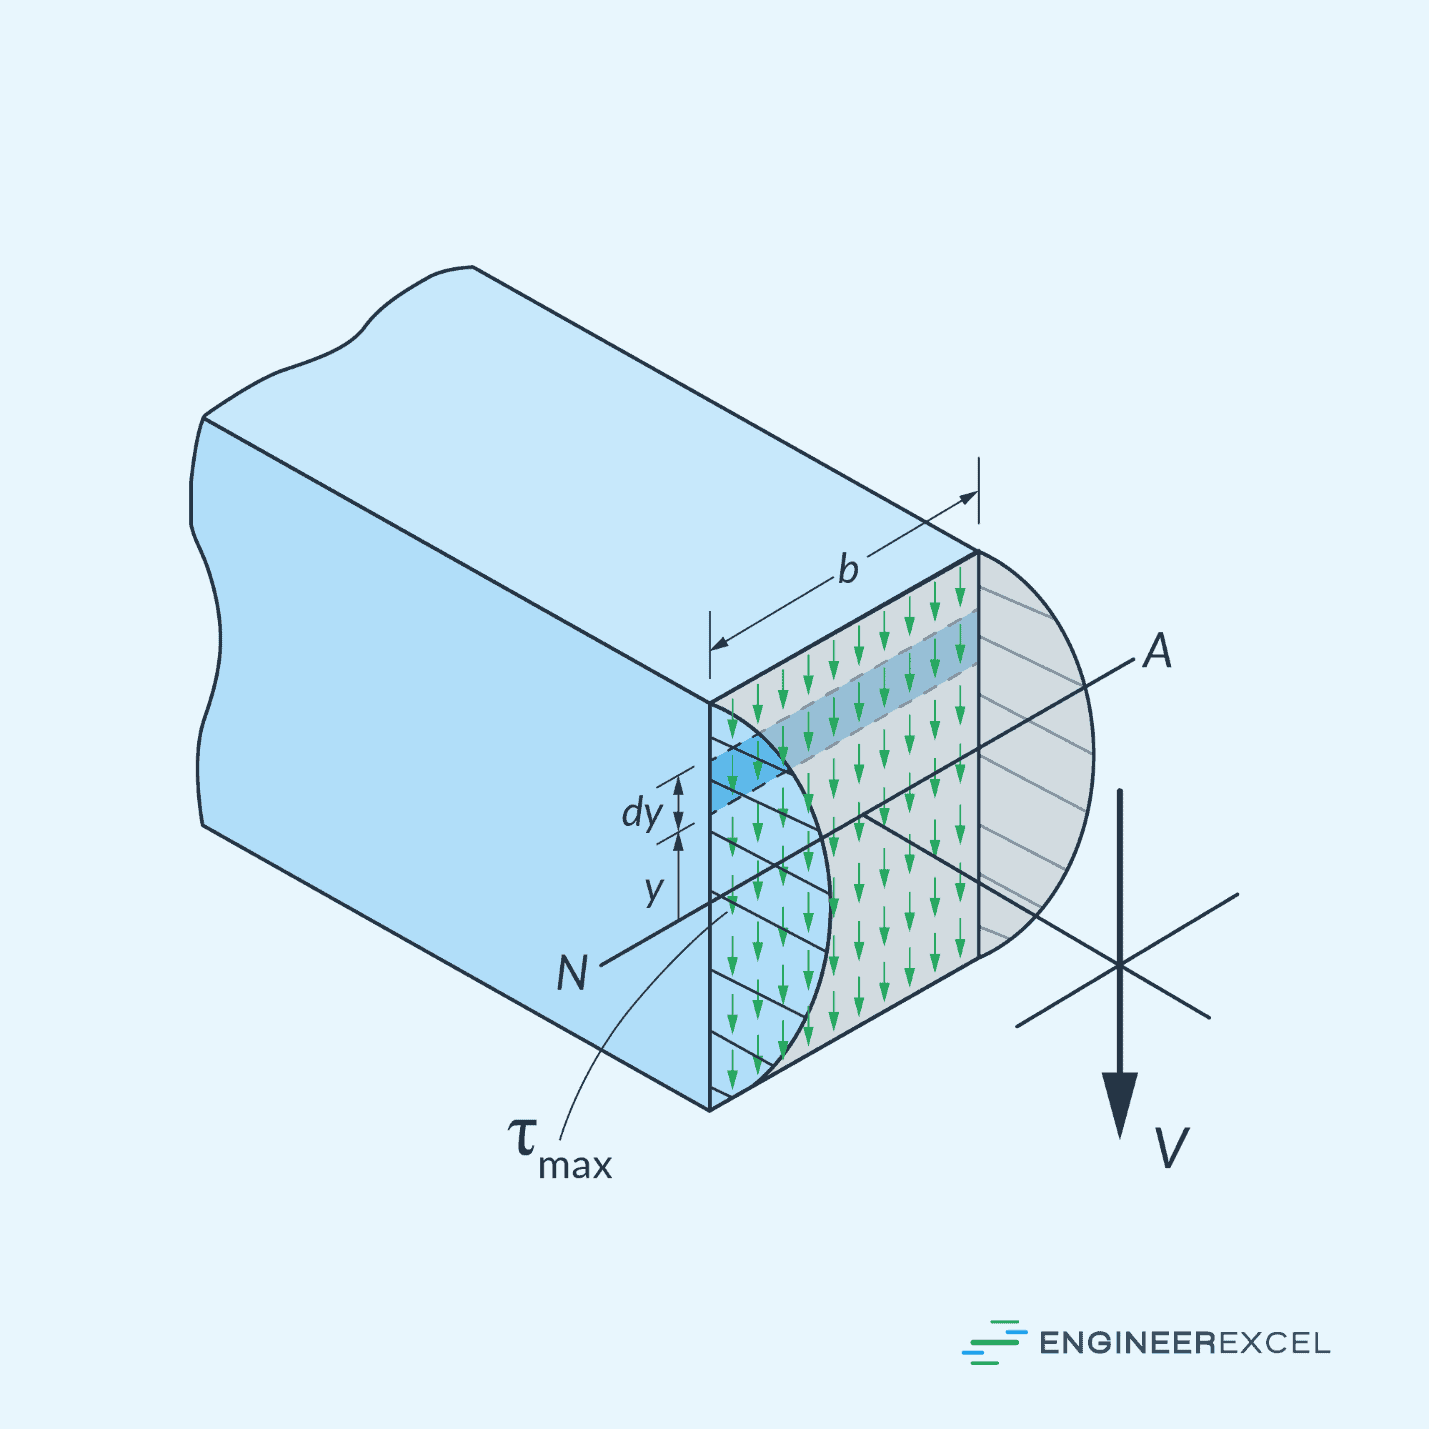
The first moment of area, also known as the centroidal or static moment of area, quantifies a shape’s distribution of area about a specific axis. For example, assuming that we want to determine the shear stress along the segment of width t, shown in the diagram above, the first moment of area A’ can be calculated as follows:
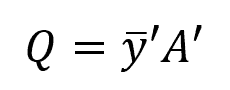
Where:
- A’ = area above (or below) the segment where t is measured [m2]
- ȳ’ = distance from the neutral axis to the centroid of A’ [m]
Hence, based on the shear formula, the magnitude of the shear stress at a particular point primarily depends on its distance from the neutral axis.
Shear Stress Distribution in Rectangular Sections
In rectangular sections, the distribution is not uniform across the depth of the beam; instead, it follows a parabolic pattern, with maximum shear stress occurring at the neutral axis and gradually reducing to zero at the top and bottom edges of the section. This pattern is illustrated in the diagram below.

Derived from the shear formula, a simplified formula to determine shear stress at any point within a rectangular section is given by:
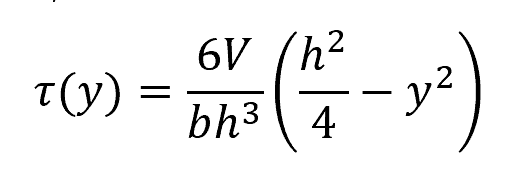
Where:
- y = distance from the neutral axis [m]
- h = height of the section [m]
- b = base of the section [m]
The shear formula is based on the assumption that shear stress is evenly distributed over the section’s width. However, in reality, shear stress varies across the width, with the maximum occurring at the extreme sides and the minimum at the middle, as shown in the diagram below.
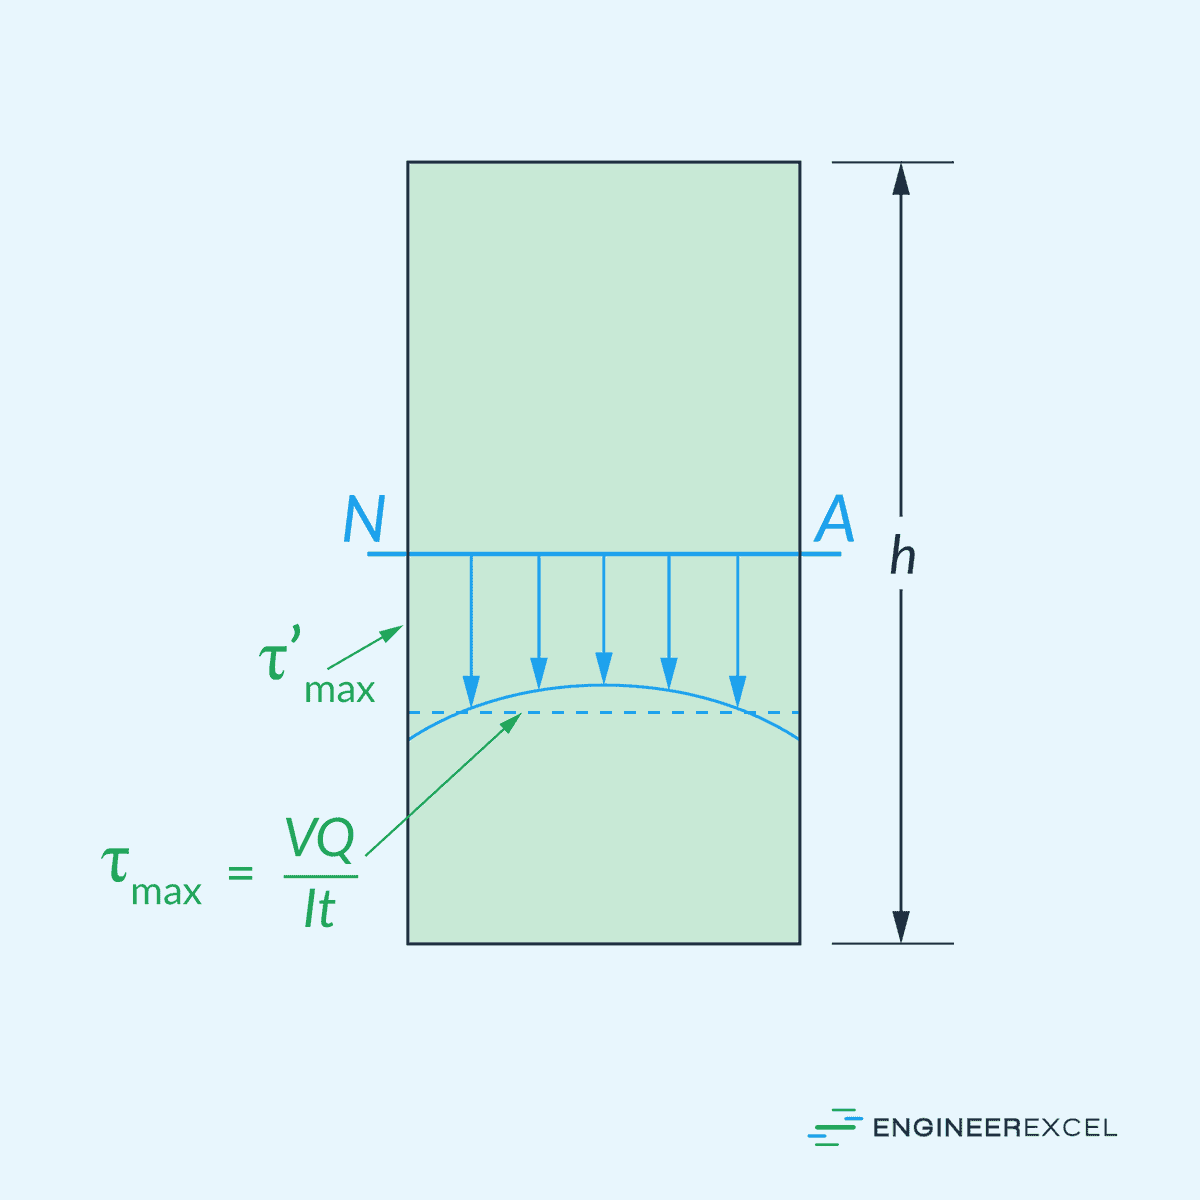
The discrepancy between the actual maximum shear stress at the sides and that calculated using the shear formula depends on the section’s base-to-height ratio. For sections with a b/h ratio of 0.5 or lower, the error is less than 3%, but it increases for flatter sections, reaching about 40% for a b/h ratio of 2.
Shear Stress Distribution in Non-Rectangular Sections
For non-rectangular sections, the shear stress distribution becomes more complex due to their geometry. For example, in I-beams and T-beams, there is a jump in shear stress at the flange-to-web junctions. Since these are points of sudden cross-sectional change, there is stress concentration that occurs, thereby affecting the magnitude of the shear stress.
Additionally, if the shear formula is applied to calculate the shear stress in a cross section featuring an irregular or nonrectangular boundary, the shear stress will be directed downward. However, in reality, the shear stress acting on this element should be directed tangent to the boundary, as illustrated in the diagram below.
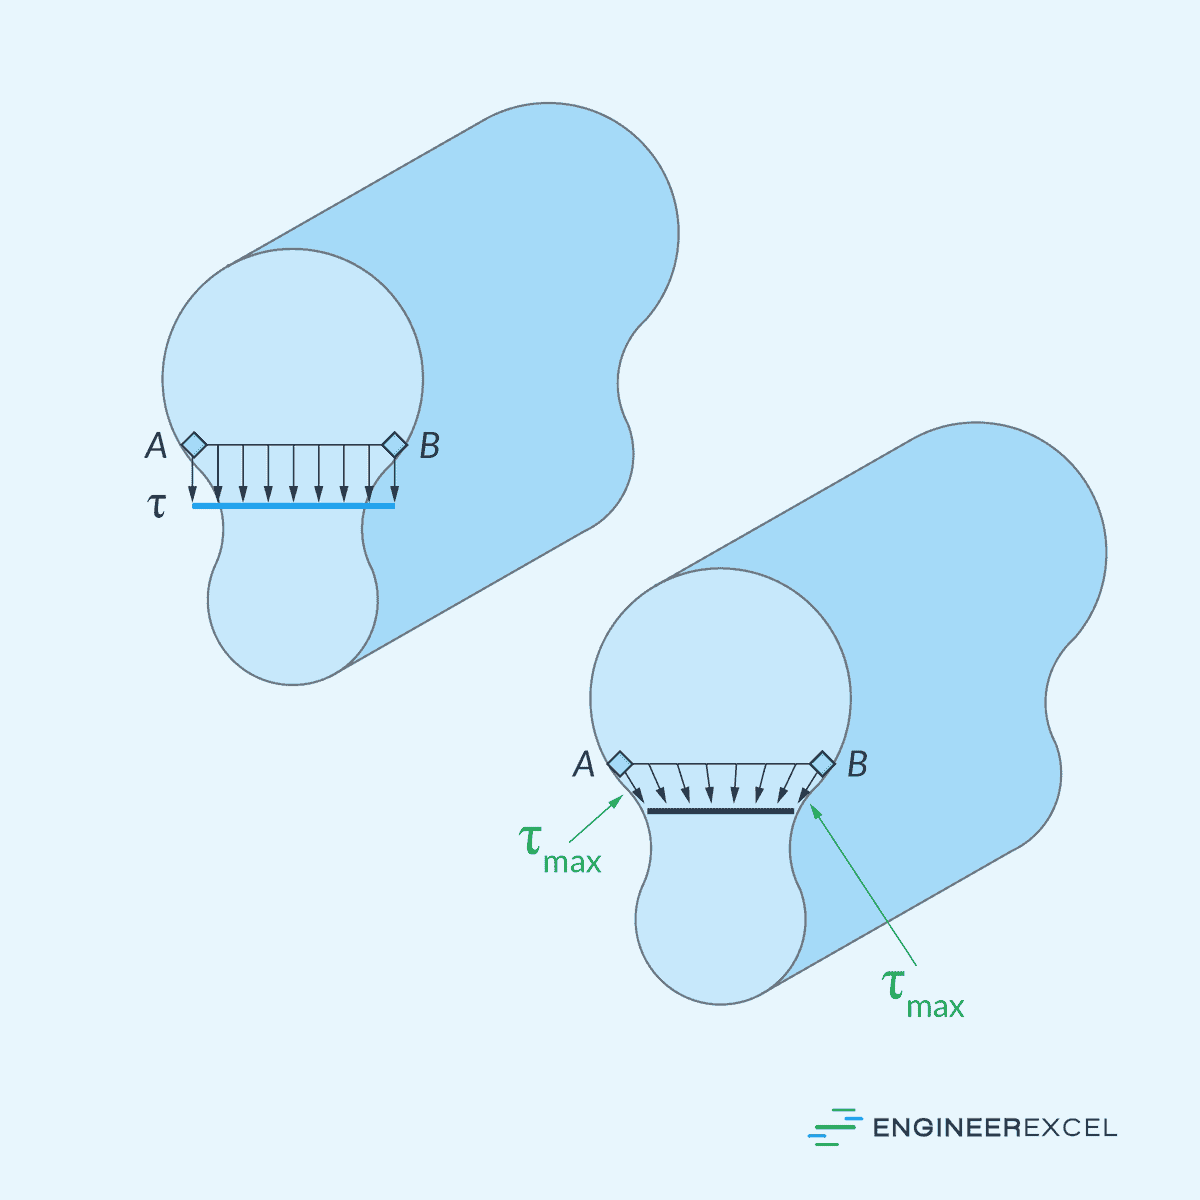
Therefore, in these instances, determining the shear stress requires more advanced methods based on the theory of elasticity.