In structural engineering, shear and moment diagrams are used to illustrate the distribution of internal shear forces and moments within a beam. Engineers use these diagrams to analyze beams and ensure that they can effectively support the applied loads.

In this article, we will explore the importance of shear and moment diagrams as well as the different methods for constructing them.
Shear and Moment Diagrams Explained
Beams, as structural elements, are commonly employed to support loadings. These applied loadings induce internal shear force and bending moment within the beam. The internal shear force refers to the force that resists the sliding or separation of beam layers along its length, while the bending moment resists the force that causes the beam to bend.
To design a beam, it is essential to determine the maximum shear and moment in the structure. One of the ways to do this is through the use of shear and moment diagrams.

Elevate Your Engineering With Excel
Advance in Excel with engineering-focused training that equips you with the skills to streamline projects and accelerate your career.
Shear and moment diagrams are graphical representations of the variation of shear force and bending moment along the length of a structural element such as a beam. The horizontal axis normally represents the length of the beam, while the vertical axis represents the magnitude and direction of the shear and bending moment.
These diagrams serve as a helpful tool for understanding the internal reactions and stresses that occur within a beam.
Shear and Bending Moment Sign Convention
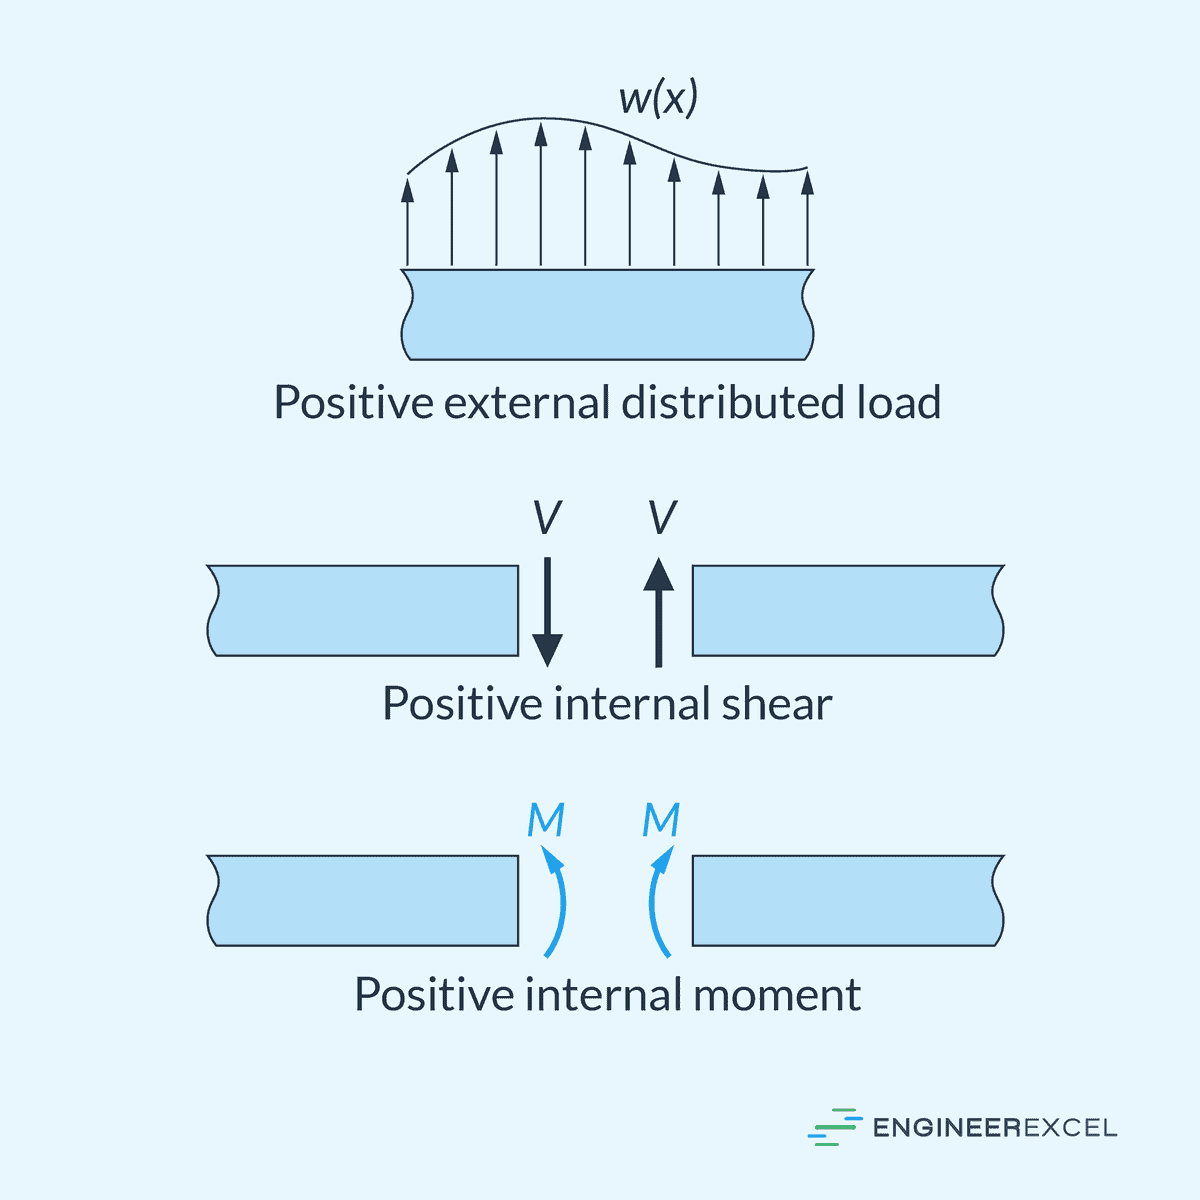
A consistent sign convention is important for correctly interpreting and plotting shear and bending moment diagrams. The commonly used sign convention is that the positive direction for distributed load is upwards on the beam. When distributed load acts in the opposite direction (downwards), it is considered negative.
Following the same convention, an internal shear force that causes a clockwise rotation of the beam segment is considered positive, while a counterclockwise rotation signifies a negative internal shear force.
Regarding internal moments, if a segment experiences compression in its top fibers, causing it to be concave upwards, this represents a positive internal moment. Conversely, if the segment bends in the opposite direction, a negative internal moment is present.
It is important to note that the choice of origin and positive direction for the horizontal axis (x) is arbitrary. However, it is common to place the origin at the left end of the beam and the positive direction to the right.
When calculating shear and moment diagrams, recognizing and applying the correct sign convention helps avoid errors and ensures accurate interpretation of the results.
Plotting Shear and Moment Diagrams
In order to construct shear and moment diagrams for a beam, first, determine the reactive forces and couple moments acting on the beam, and resolve all the forces into components acting perpendicular and parallel to the beam’s axis. Once these are determined, derive the shear and moment functions.
Shear and moment functions generally exhibit discontinuity at points where the distributed load changes or concentrated forces or couple moments are applied. Therefore, these functions must be calculated for each region of the beam between any two such discontinuities.
To do this, section the beam at each region and then draw the free-body diagram of one of the segments. The shear can be obtained by summing forces perpendicular to the beam’s axis, while the moment can be obtained directly by summing moments about the sectioned end of the segment.
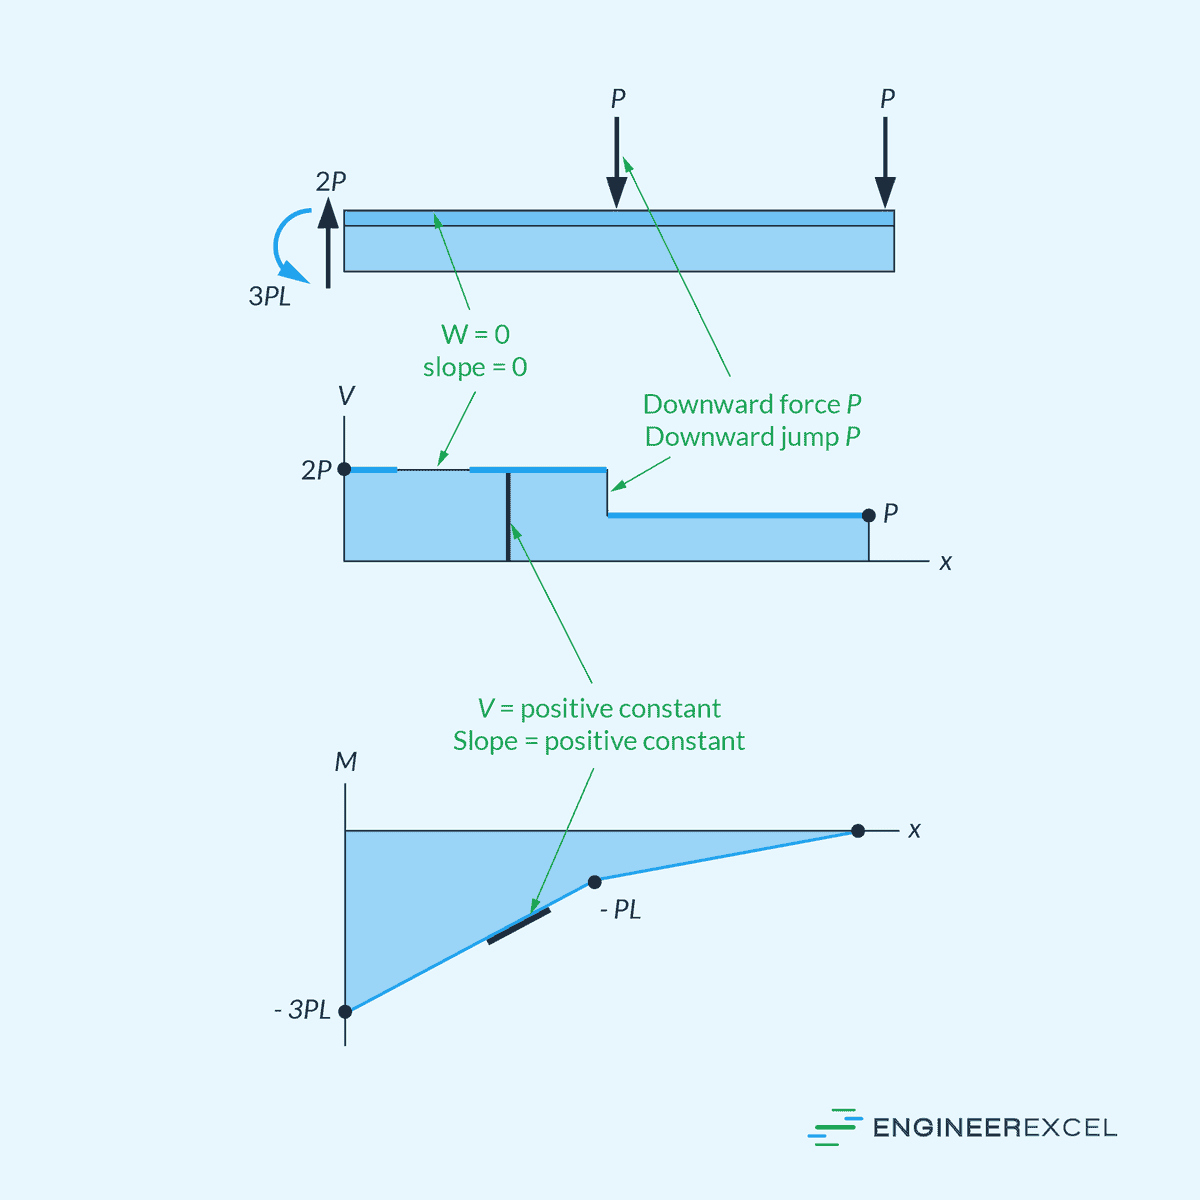
Finally, the shear and moment diagrams can be plotted by creating shear force (V) versus x and bending moment (M) versus x graphs. It is generally convenient to display the shear and moment diagrams below the free-body diagram of the beam, allowing the reader to easily compare the diagrams with the original beam structure, as shown in the diagram below.
Graphical Method of Constructing Shear and Moment Diagrams
When a beam is subjected to various loadings, determining shear and bending moment as functions of x, and then plotting these equations can be tiresome. A simpler method is using the graphical method, which is based on the following integral relations:
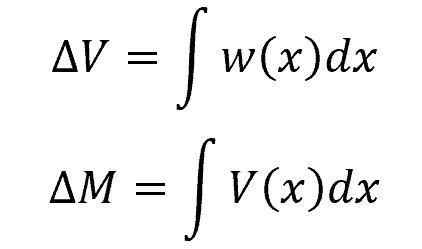
The first equation states that the slope in shear diagram is equal to the area under the loading curve, while the second equation states that the slope in moment diagram is equal to the area under the shear diagram.
Based on these relations, the shear diagram can be drawn by using the concept that the change in shear between any two points is equal to the area under the load diagram between the two points. Similarly, the moment diagram can be drawn using the concept that the change in moment between any two points is equal to the area under the shear diagram between the two points.
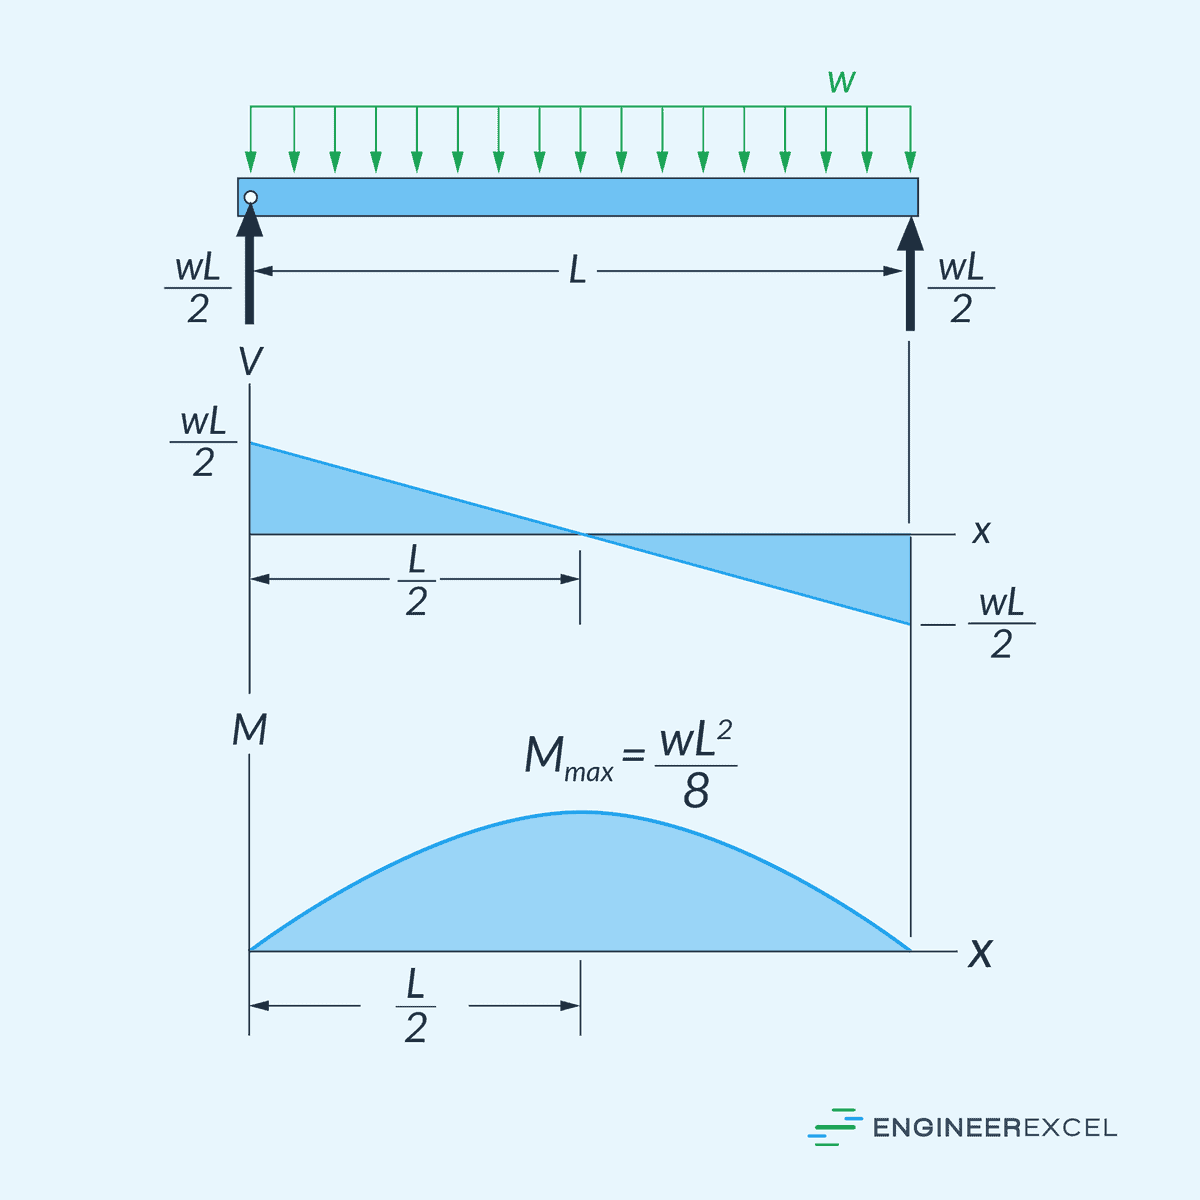
This method is illustrated in the diagram below.