
I’ve talked about the various procedures for fitting different types of curves on this blog before, but today I want to show you a technique for hyperbolic curve fitting in Excel. There’s no built-in tool for curve-fitting these functions in Excel, but we can get it done with a little bit of math and creativity.
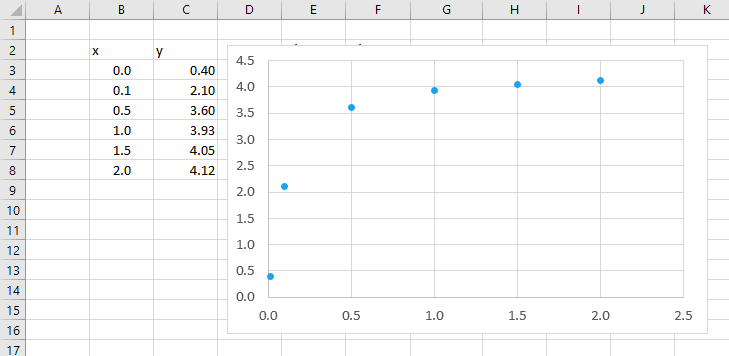
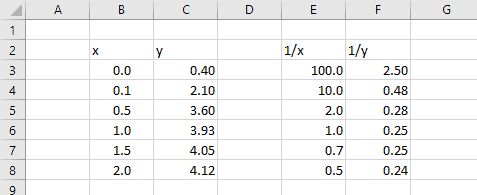
We’ll look at this data set, which shows a very hyperbolic characteristic when plotted:
Hyperbolic Curve Function
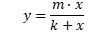
A hyperbolic function has the form:

Elevate Your Engineering With Excel
Advance in Excel with engineering-focused training that equips you with the skills to streamline projects and accelerate your career.
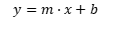
We can use the SLOPE and INTERCEPT functions to get the values of m and k that best fit the hyperbolic equation to the data, but first we need to “linearize” the equation. That means we need to get it in a form that looks like the equation of a line:
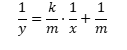
By taking each side to the power of -1 and doing a little bit of rearranging, we get the linear form of the hyperbolic equation:
Fantastic! Now what?
Hyperbolic Curve Fitting in Excel
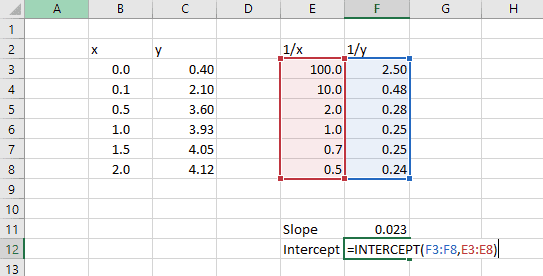
We need to create two new columns in our spreadsheet – one for values of 1/x and another for the values of 1/y.
In E3, enter:
=1/B3
And in F3 enter:
=1/C3
When the formulas are filled down, we get the following:
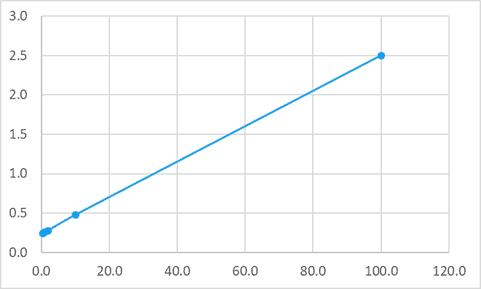
Just as a quick check, we can plot these two new columns (E and F) on a chart and see that the relationship between them is indeed linear. (How about that? It’s almost like I planned it that way. :))
Remember, we’ve linearized the hyperbolic equation into the form:
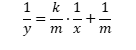
So, the term k/m is now the slope of this equation and 1/m is the intercept.
There are a couple of different ways we could go about getting the best-fit slope and intercept from this data. We could use the LINEST function to get both at once, or we could use the SLOPE and INTERCEPT functions to obtain the values separately.
For this exercise, SLOPE and INTERCEPT are more straightforward, so let’s use them.
Calculating the Slope and Intercept
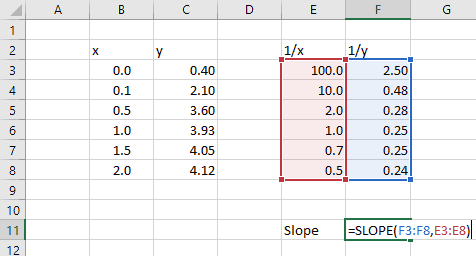
First, we’ll calculate the slope, k/m, of the data with the slope function:
=SLOPE(known_ys,known_xs)
Since we’re concerned about the linear form of the equation, known_y’s is the calculated column containing the 1/y values, and known_x’s is the 1/x values.
Next, we can calculate the intercept, 1/m:
=INTERCEPT(known_ys,known_xs)
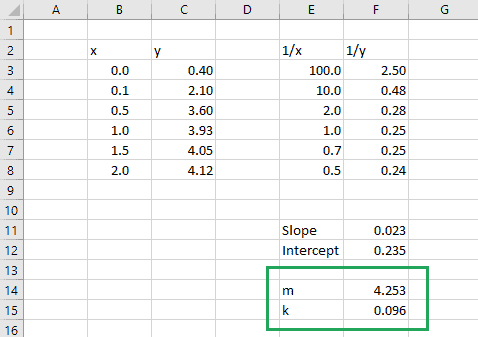
Finally, we can calculate the values of k and m.
First we’ll calculate m, which equals 1 divided by the intercept:
=1/F12
Then, we can calculate k, which is equal to the slope times m.
=F14*F11
Checking the Hyperbolic Curve Fit
Ok, now it’s time for the moment of truth.
If we did everything correctly, we should be able to plot a hyperbolic curve using the m and k values obtained above and it should fit the original data.
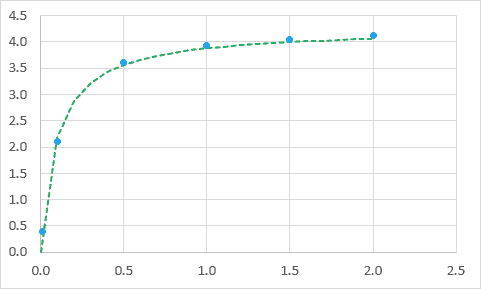
Great! It worked. (Did you really think I’d write a post about it if it didn’t? ;))
Wrapping Up
I hope this post has helped you learn how to do hyperbolic curve fitting in Excel. The trick, with hyperbolic functions as well as any other type of curve-fitting, is to linearize the equation, or make it look like the equation of a straight line. Then you can easily spot the terms that look like the slope and intercept, and use the functions to get the coefficients necessary to fit the curve. Of course, there are other methods too, like using Solver, but that’s a post for another day!