
Solver can also be used for a multiple linear regression analysis. For this section, we’ll be using the spreadsheet from the last section after working through the example so that we can compare the two methods.
Copy the coefficients calculated with LINEST. Right-click the first cell below the coefficients and paste the values.
This will allow you to compare the LINEST method with the Solver method at the end.
Delete the coefficients and enter a guess value of 1 in each cell. There’s already a column to calculate the predicted amount of escaping hydrocarbon based on these coefficients. Solver will also need an error to minimize, so insert a column beside the prediction and label it Error. The error will simply be the difference between the predicted value and the measured value. Enter in the first cell:
=G6-F6
Select that cell and double-click the fill handle. You’ll also need an overall error in a single cell, so choose a cell that will be the objective and enter the formula:

Elevate Your Engineering With Excel
Advance in Excel with engineering-focused training that equips you with the skills to streamline projects and accelerate your career.
=SUMSQ(H6:H37)
Now, you can use the Solver to make that value as small as possible. Go to Data > Solver and set that cell as the objective. Choose to minimize it (Min). The variable cells will be all of the coefficients and the constant (J6:N6).
For this problem, there’s no reason to force the coefficients to be positive. It’s very possible that the mass of escaping hydrocarbon is inversely proportional to one of the independent variables, or at least that it has a negative slope with respect to one. If you look at the LINEST solution from before, there are a few negative coefficients. Therefore, un-select the checkbox for Make Unconstrained Variables Non-Negative. Then click Solve.
Solver returns values that are very near the LINEST results:
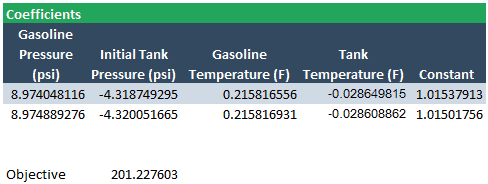
There are some slight differences, but given the number of significant digits in the input data, the differences are probably negligible. We can quantify the difference between the LINEST result and the Solver result by inserting a new row below the coefficients and subtracting the two. Select these cells and put them into scientific notation using the Number Format drop-down menu in the Home tab.
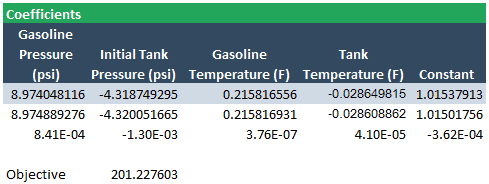
The largest difference between the two methods is on the order of 10-3. Considering the resolution of the input data, the two sets of results can be considered nearly identical.
Both of these methods return very similar results for a multiple linear regression. The LINEST method is a little faster, but the Solver method allows you to have more insight into and control over the process. Another advantage of Solver is that you can Save and Load models on your spreadsheet with different inputs to see if you can improve the result. You can use either one, depending on what you are more comfortable with.