
A large number of thermodynamic problems involve mixtures of gases that are in contact with a solid or liquid phase of one of the components. One common example of this is the gas-vapor mixture that is widely used in HVAC applications. Two of the most important parameters used to characterize gas-vapor mixtures are the dew point and the wet bulb temperature.

Understanding Dew Point and Wet Bulb Temperature
Dew point and wet bulb temperature are important concepts in the field of mechanical engineering, particularly in the design and operation of HVAC systems. Both concepts are related to the amount of moisture in the air, but they measure different aspects of it.
For a gas-vapor mixture, the dew point is the temperature at which the vapor condenses when it is cooled at constant pressure, assuming constant water content. In other words, it is the temperature to which air must be cooled at constant pressure to become saturated with water vapor.
Consider the T-s diagram of a gas-vapor mixture, shown below:

Elevate Your Engineering With Excel
Advance in Excel with engineering-focused training that equips you with the skills to streamline projects and accelerate your career.
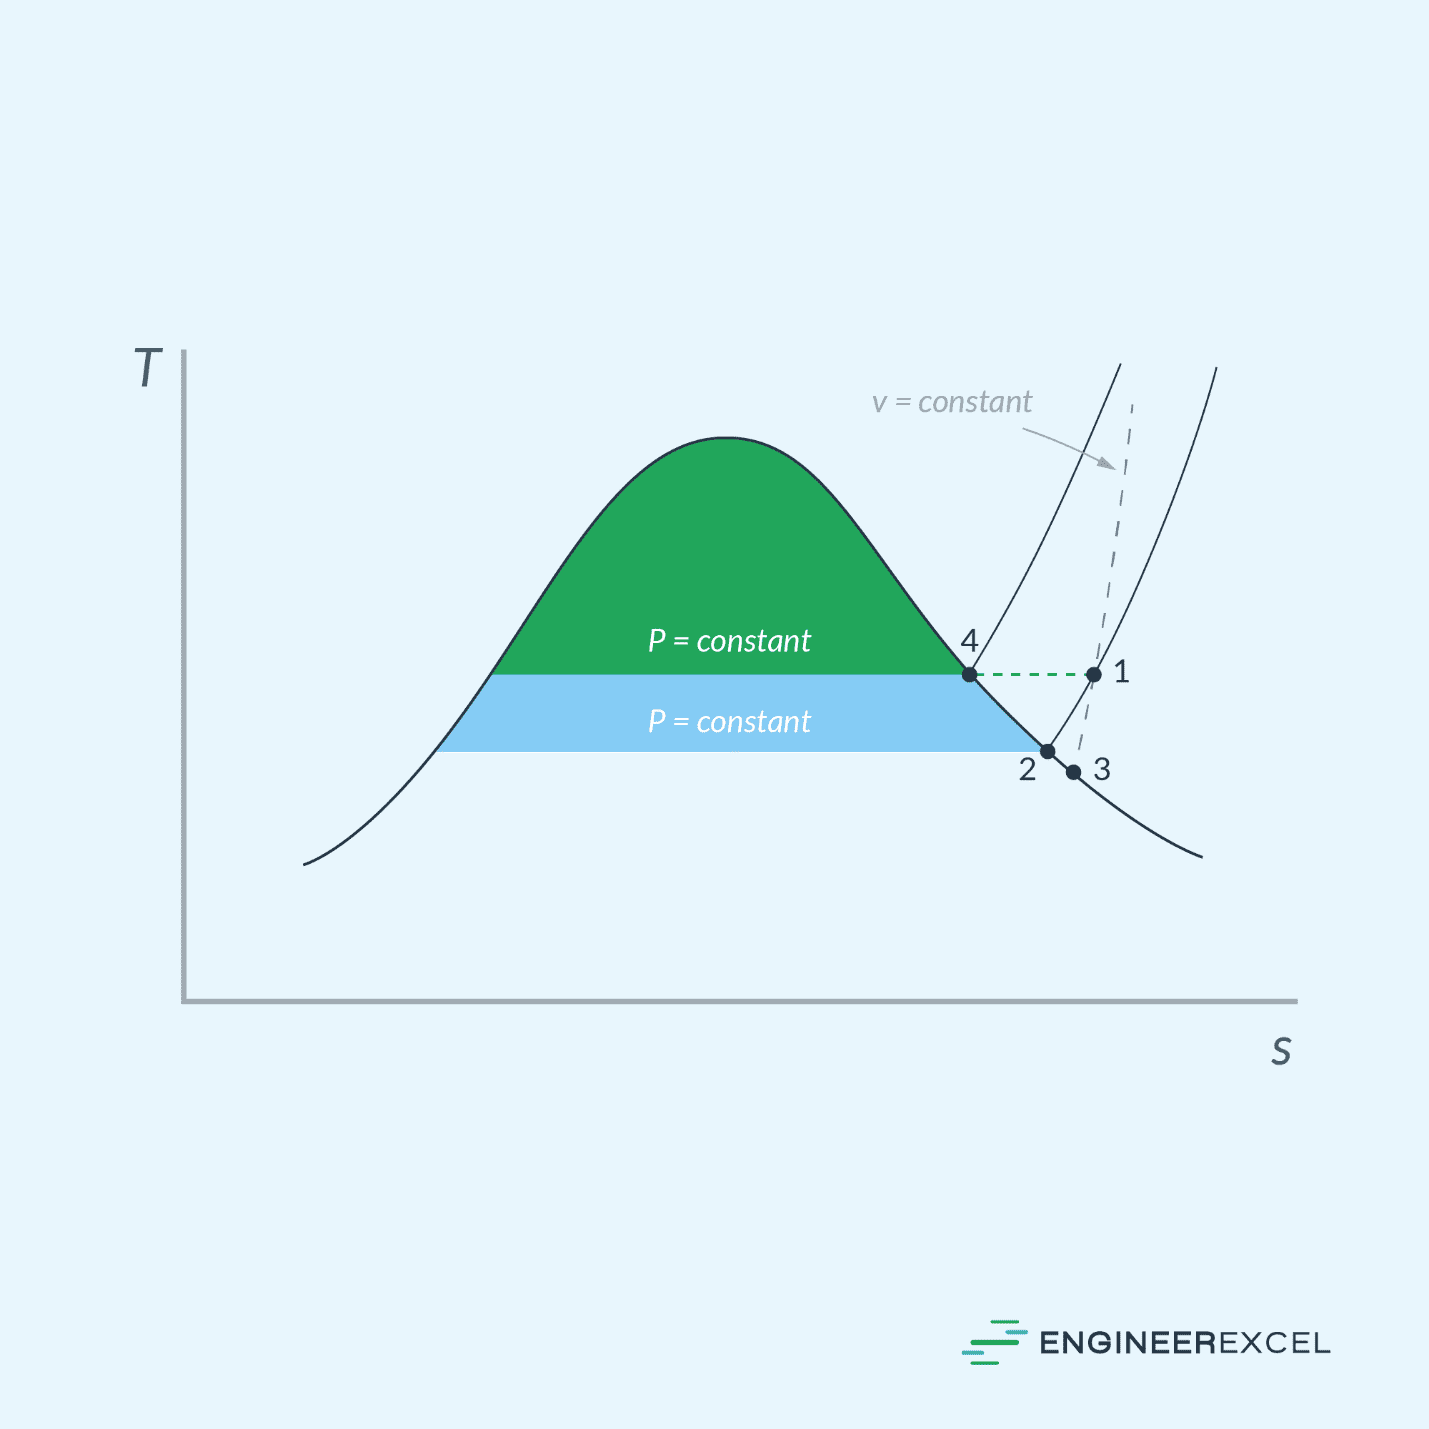
Suppose that the gaseous mixture is initially superheated at state 1. If the mixture is cooled at constant pressure down to state 2, the temperature at state 2 indicates the dew point temperature of the mixture at that pressure.
The dew point temperature provides insight into the amount of moisture in the air. The higher the dew point temperature, the higher the moisture content for air at a given temperature.
When the dew point temperature and actual air temperature are equal, the air is said to be saturated. Hence, dew point temperature is always less than the air temperature.
On the other hand, the wet bulb temperature, is defined as the temperature of air cooled to saturation by the evaporation of water into it. In other words, it is the lowest temperature that can be achieved through evaporative cooling of a surface.
At 100% relative humidity, the wet-bulb temperature is equal to the air temperature. However, at lower humidity, the wet-bulb temperature is lower than the air temperature due to evaporative cooling.
Hence, the bigger the difference between the temperature of the air and the wet-bulb temperature, the relatively drier the air must be.
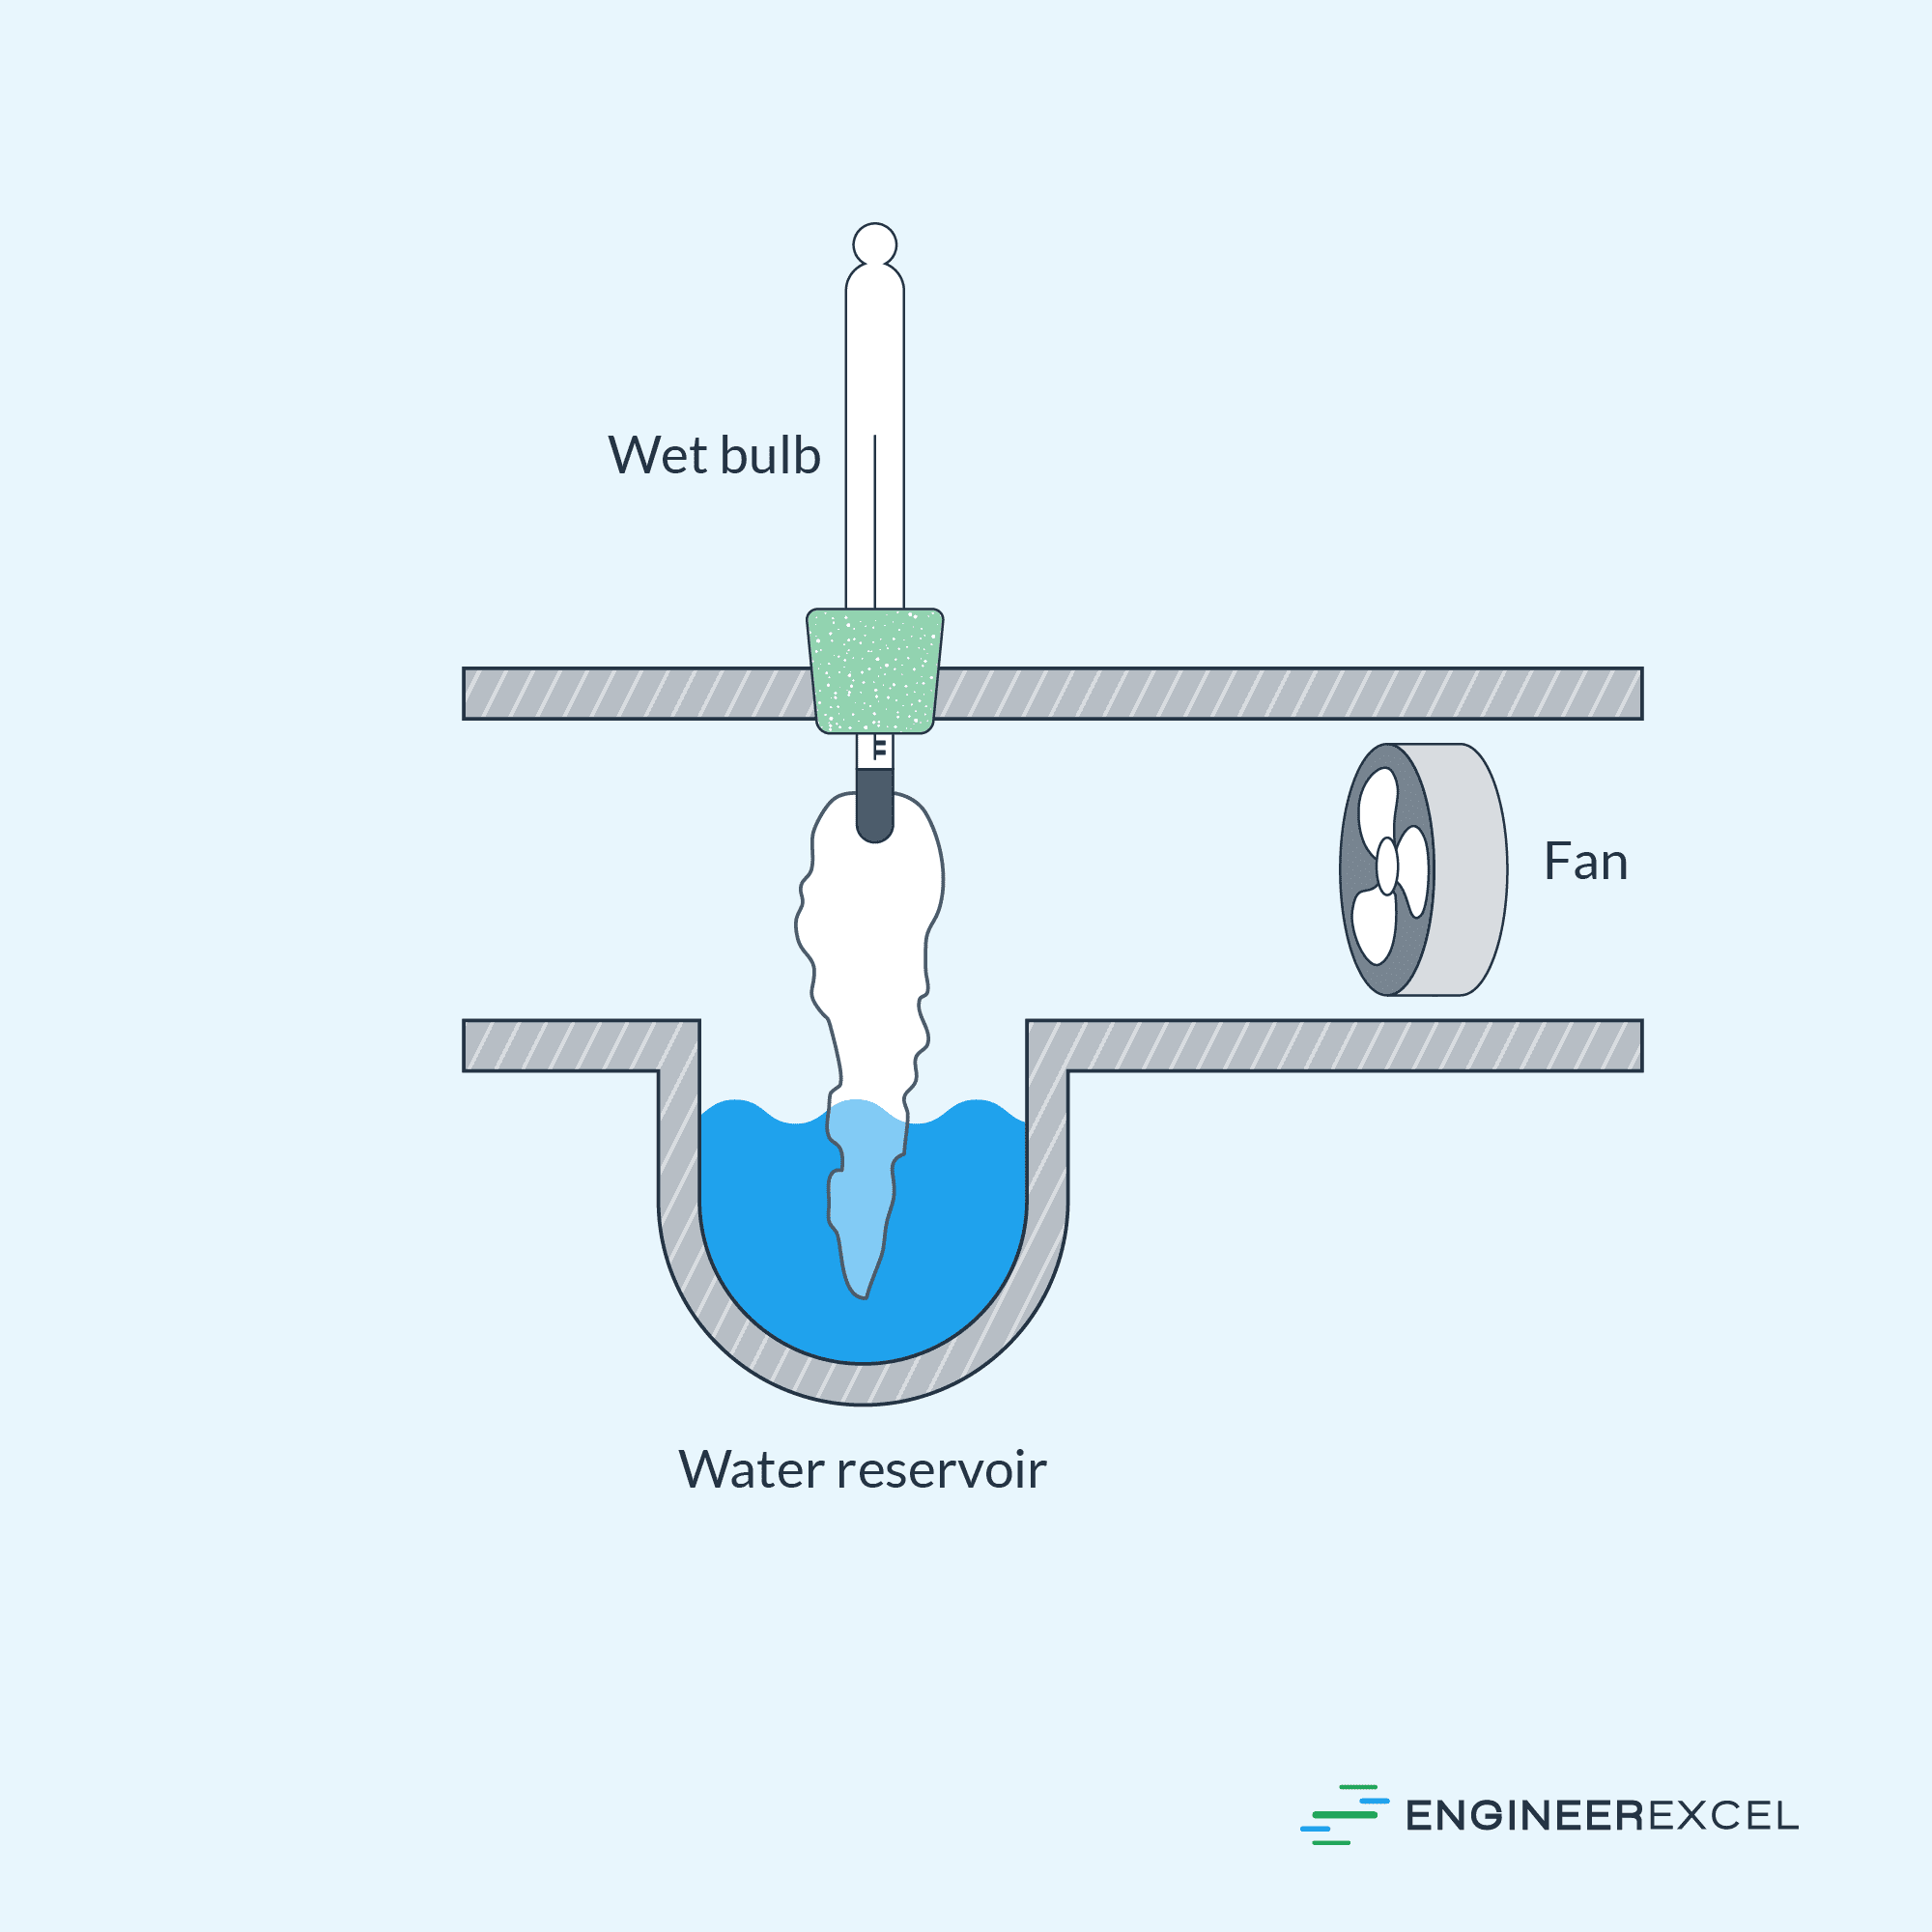
The wet bulb temperature is measured using a wet bulb thermometer, whose bulb is covered with a cotton wick. The wick is moistened with water, and the thermometer is exposed to the air.
As the water evaporates from the wick and diffuses to the surrounding air, the water in the wick cools. The wet bulb temperature is the temperature that the thermometer reaches when it can no longer cool down due to the saturation of the wick.
A diagram of a steady state apparatus used to measure dry bulb temperature is shown below.
It is important to note that the value of the wet bulb temperature that is normally measured is affected by factors such as the airflow velocity and heat transfer rate, not simply on thermodynamic equilibrium properties.
Calculating Dew Point from Wet Bulb Temperature
Directly measuring the dew-point temperature can be challenging. Therefore, it is more common to measure the wet-bulb temperature first, and then use it to determine the dew-point temperature. This process can be done using a psychrometric chart
A psychrometric chart is a plot of humidity ratio as a function of dry-bulb (air) temperature, including parameters such as relative humidity, wet-bulb temperature, and enthalpy per mass of dry air. A sample psychrometric chart at 1 atm is shown in the diagram below:

Note that for a given dry bulb temperature, total pressure, and humidity ratio, the relative humidity and wet bulb temperature are fixed. Hence, lines of constant relative humidity and wet bulb temperature can be drawn on the chart.
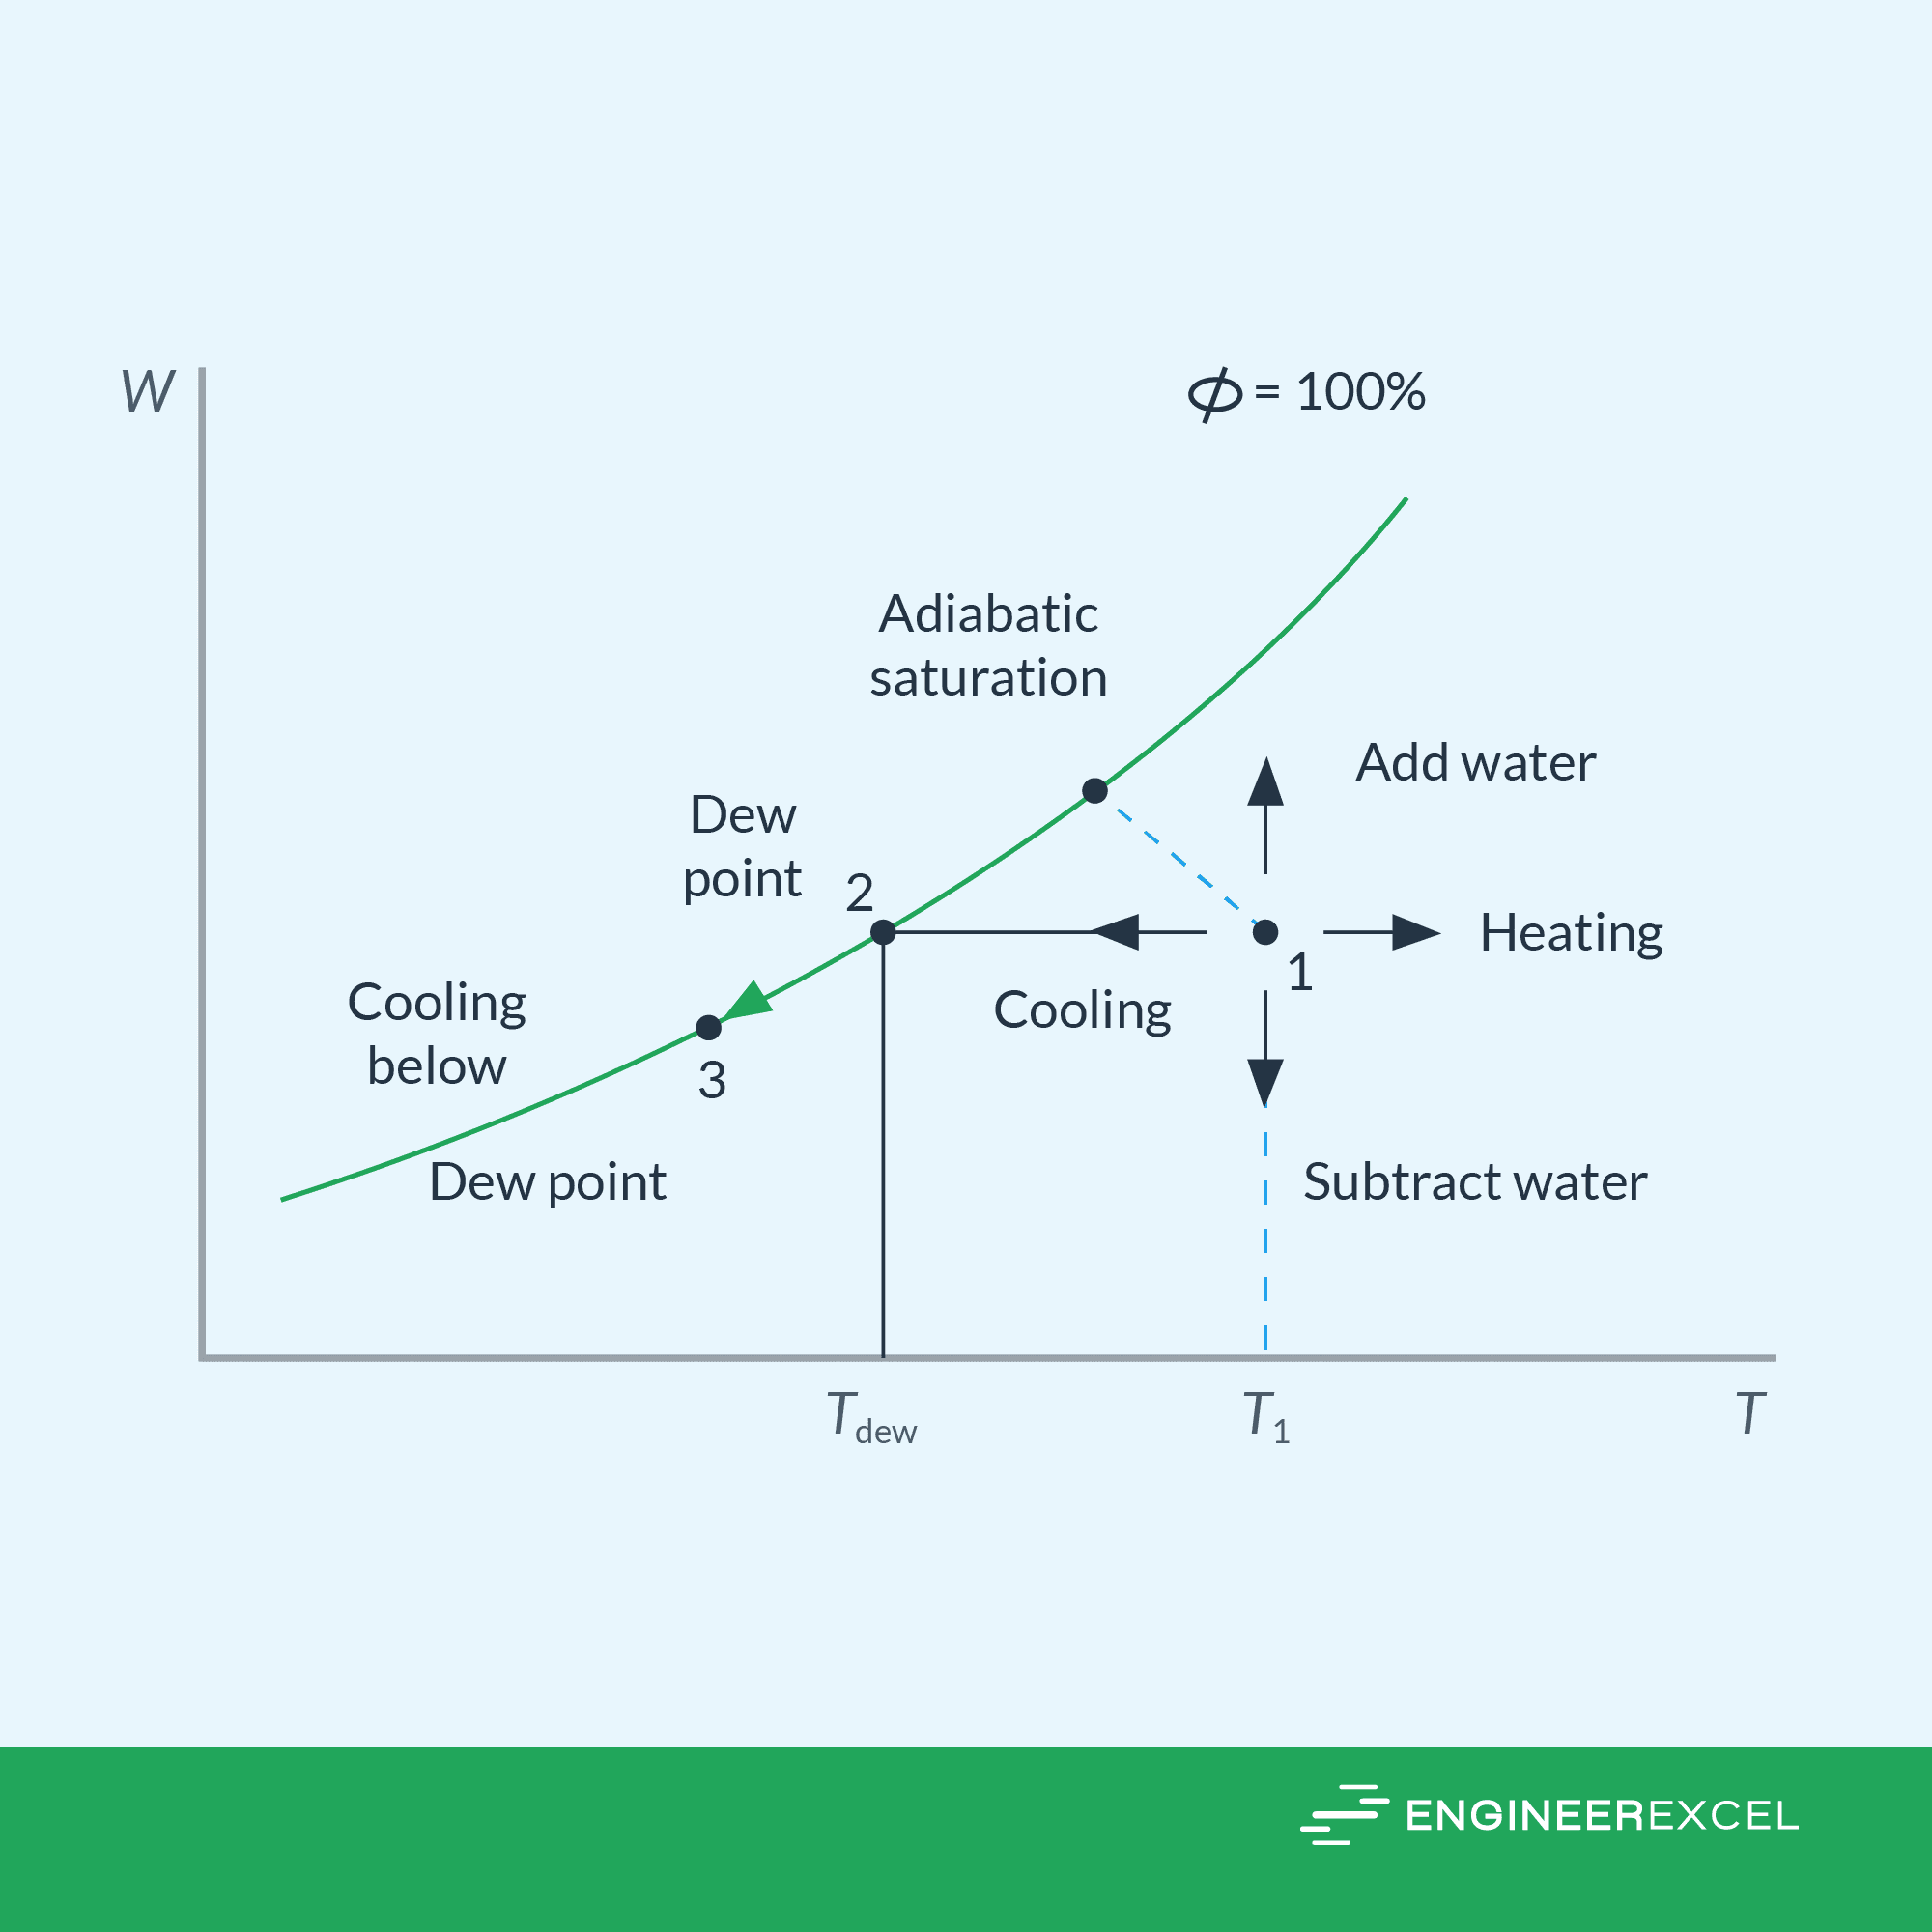
Given a wet bulb temperature value and another parameter, say humidity ratio, the dew point temperature can be obtained by drawing a horizontal straight line from the intersection point of the given parameters until it intersects with the curved line representing the saturation point.
The saturation line represents the maximum amount of water vapor that the air can hold at a given temperature. The intersection point between the straight line and the saturation line represents the dew point temperature, which can be read on the horizontal axis of the chart.
This process is illustrated in the diagram below.
Importance of Dew Point and Wet Bulb Temperature
Dew point and wet bulb temperatures are key parameters in determining the properties and behavior of moist air, which is a common component of many industrial and environmental processes. Hence, understanding these parameters is important in the design and operation of systems that involve gas-vapor mixtures.
For example, it can help to prevent condensation and subsequent damage to equipment, structures, or products that are sensitive to moisture. In HVAC systems, knowing the dew point temperature is critical in order to prevent moisture buildup in air ducts and on cooling coils.
Furthermore, they can be used to calculate the relative humidity of the air. Relative humidity is a key factor in many industrial and environmental processes, such as drying and storage of food products, production of paper, and control of mold growth in buildings.