
Bending moment is a measure of the internal force or moment that causes a structural element to bend. A bending moment diagram is a graphical representation that illustrates the variation of bending moments along the length of the structural element.

In this article, we’ll discuss bending moment diagrams in detail and how to construct them.
Bending Moment Diagrams Explained
Due to applied loadings, beams experience internal forces that counteract the loadings, whose values generally vary along the beam’s axis. Bending moment is one of these internal forces.
Bending moment in a beam is a measure of the internal force that causes a beam to undergo bending deformation. At any section of the beam, the bending moment can be calculated by multiplying the perpendicular distance from the section to the point where the external force is applied by the magnitude of the force.

Elevate Your Engineering With Excel
Advance in Excel with engineering-focused training that equips you with the skills to streamline projects and accelerate your career.
Bending moment can cause the beam to potentially fail if it is not properly designed and supported. Hence, understanding its distribution along the beam’s length is important for designing safe and efficient structures. One of the ways to do this is through the use of bending moment diagrams.
A bending moment diagram provides a graphical representation of how bending moment changes along the length of a beam. In this diagram, the horizontal axis (x) typically represents the length of the beam and the vertical axis (y) represents the magnitude and direction of the bending moment. Because it offers detailed information about the moment variation along the beam’s axis, engineers can use this diagram to determine where to place reinforcement materials within the beam or how to proportion its size at different points along its length.
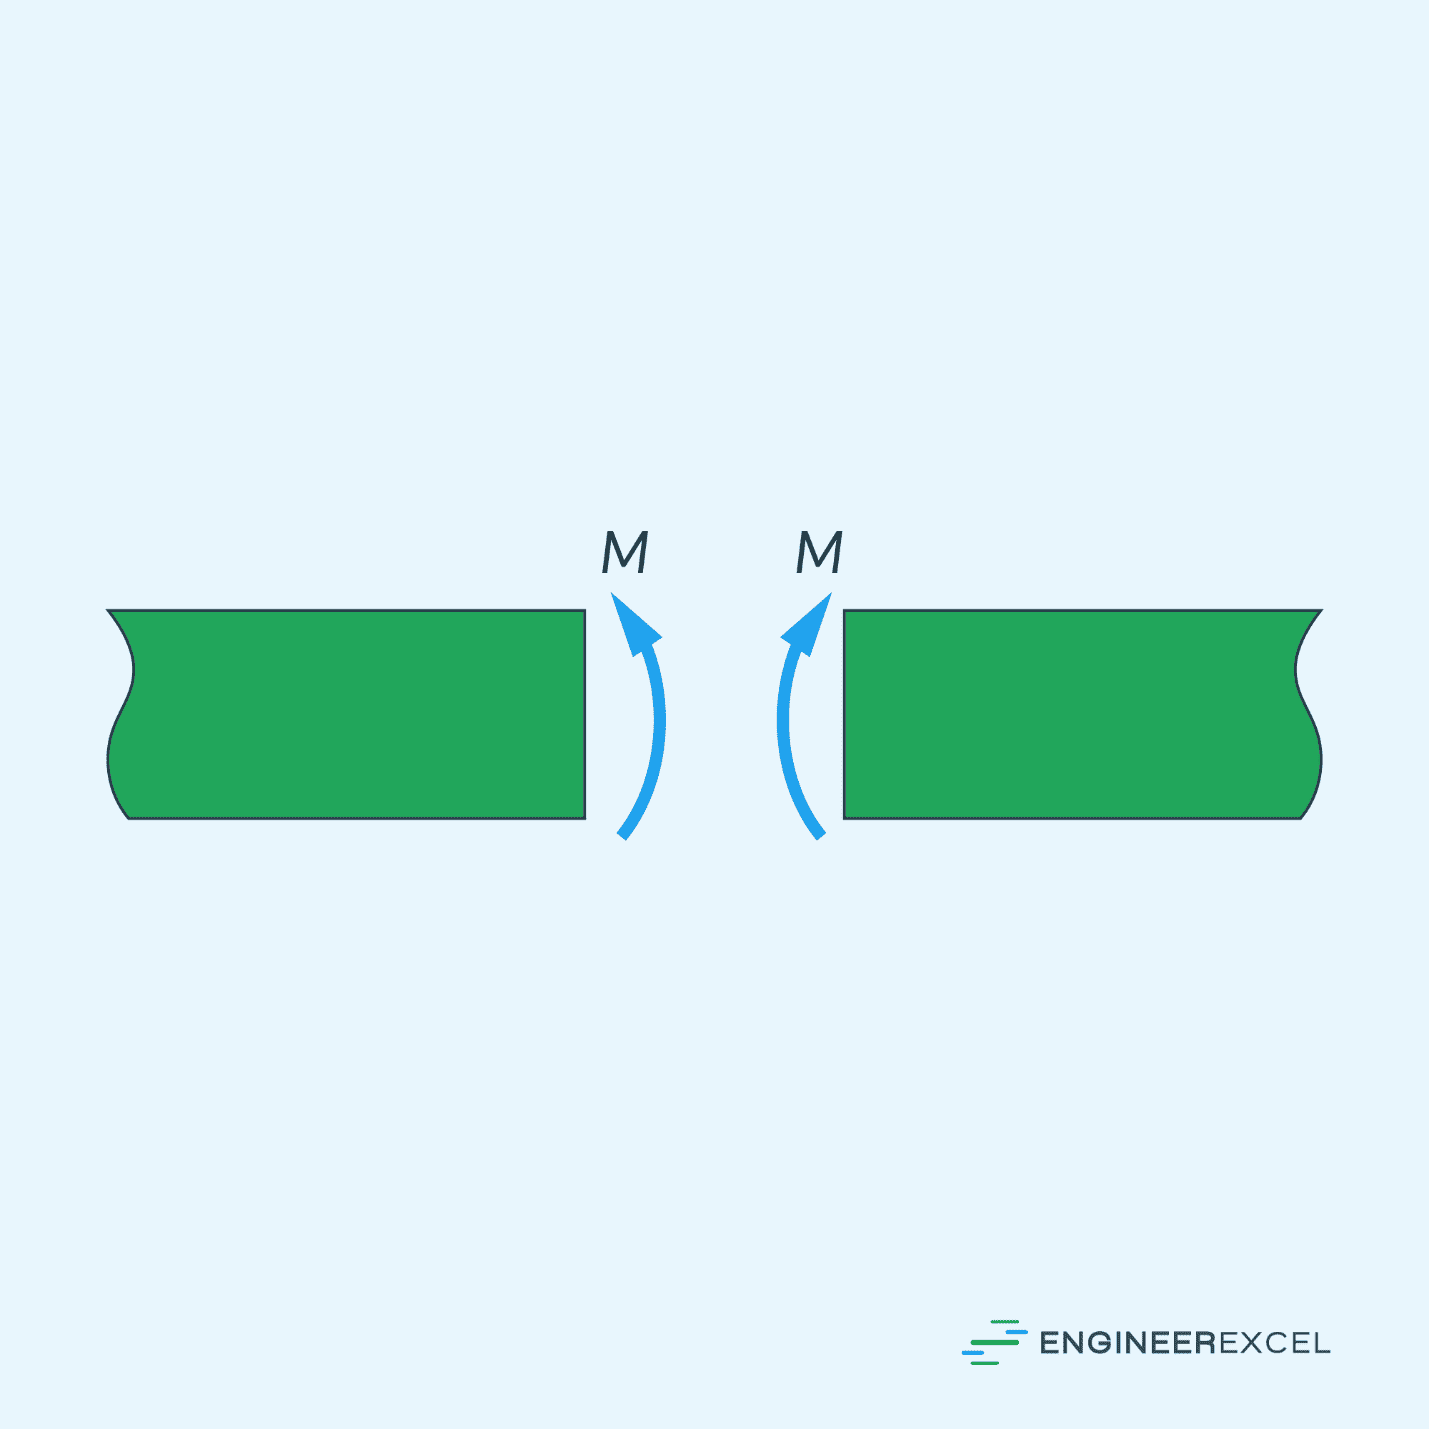
Bending Moment Sign Convention
To express the bending moment with respect to its position (x) along the beam’s length, we need to select the origin and the positive direction for x. While this choice is arbitrary, it is common to place the origin at the left end of the beam and consider the positive direction to be to the right.
Additionally, an upward load on the beam is typically regarded as positive, and the internal moment causing compression in the top fibers and tension in the bottom fibers of the segment is also considered positive. Conversely, loadings acting in the opposite direction are considered negative.
Plotting Bending Moment Diagrams
When plotting a bending moment diagram, the first step is to calculate the reactions at supports using equilibrium equations, considering external loads and moments, such that:
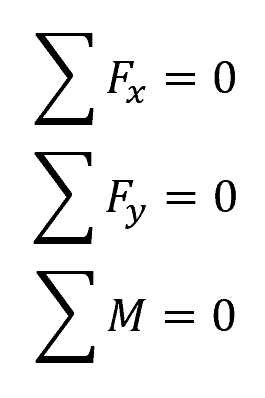
Where:
- Fx = horizontal forces [N]
- Fy = vertical forces [N]
- M = moments [N-m]
Once you’ve found all the forces acting on the beam and the support reactions, the next step is to calculate the bending moment at important points along the beam.
The internal moment functions may show discontinuities, or their slope may change abruptly, at key points where a distributed load changes or where concentrated forces or couple moments are applied. As a result, it’s important to determine the moment functions for each region of the beam between any two discontinuities of loading.
You can do this by cutting a section of the beam at these discontinuities and creating a free body diagram of the cut section. On the free body diagram, you can derive expressions for the bending moment (M) as a function of the distance (x) along the beam. The internal bending moment is typically obtained by summing moments about the sectioned end of the segment.
Once the bending moment functions are formulated, you can use these equations to find the values of M at the key points along the beam. They can also help identify the points of maximum bending stress along the beam, which is defined by zero shear force.
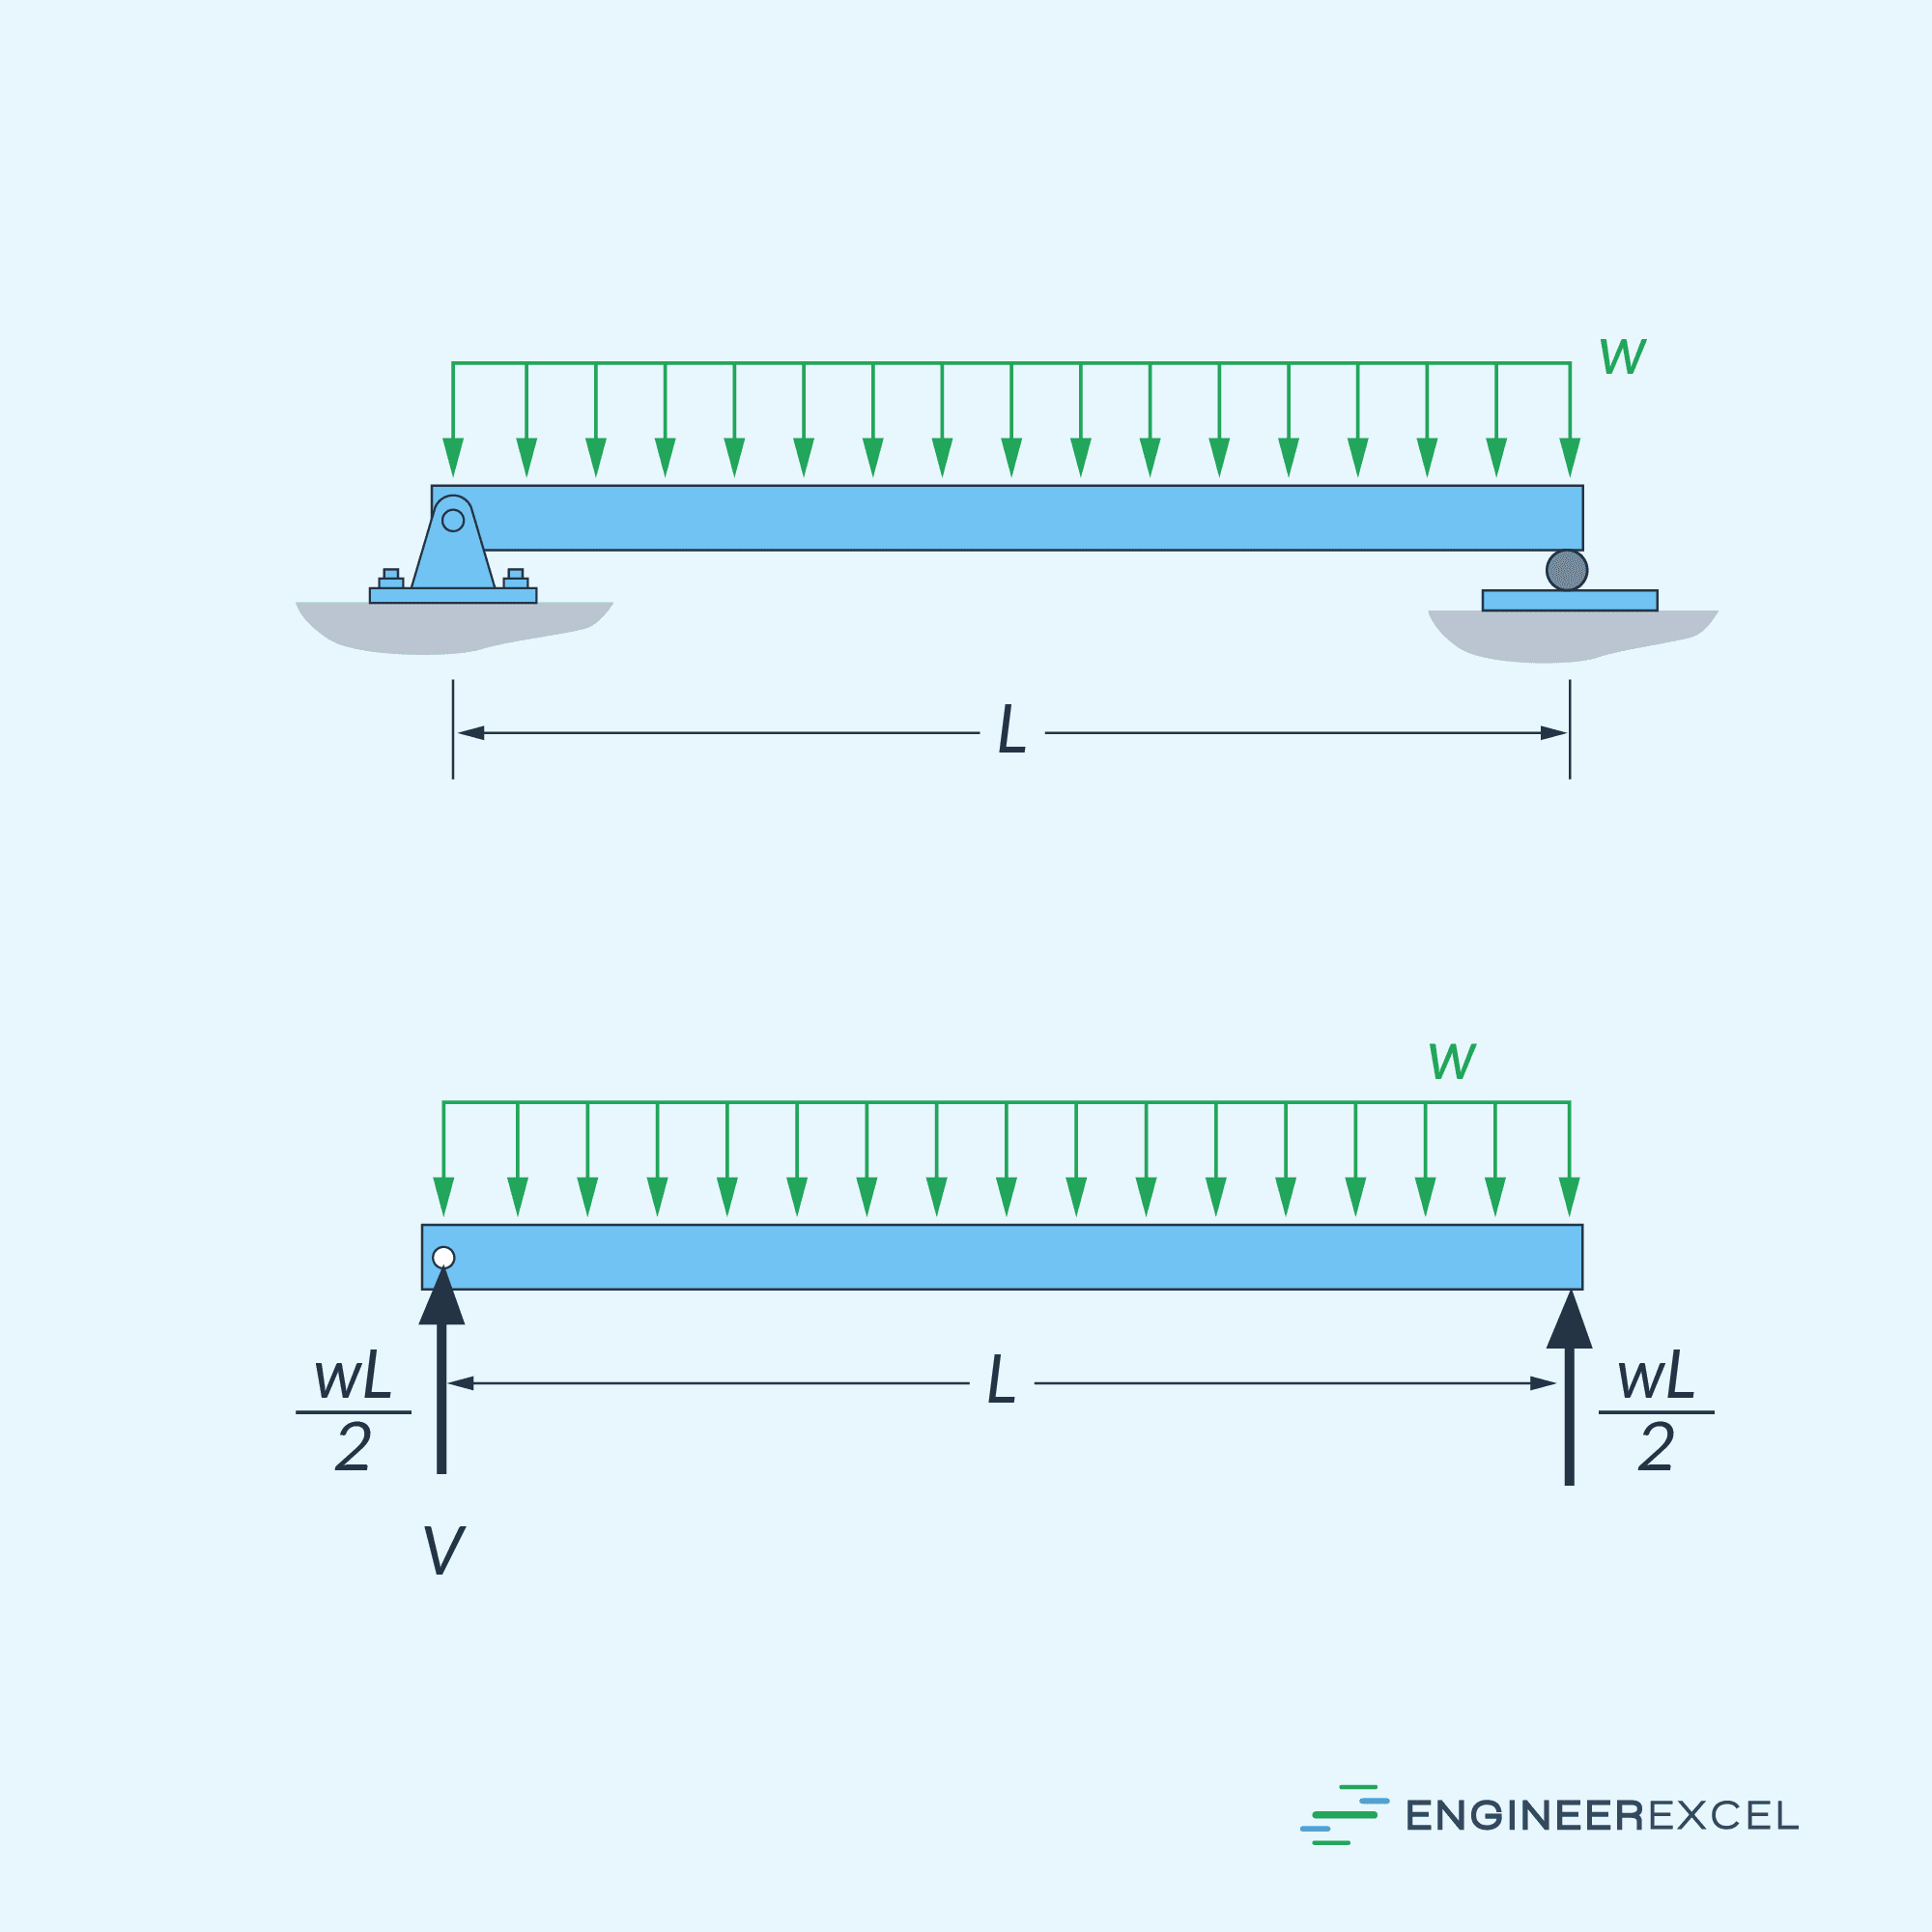
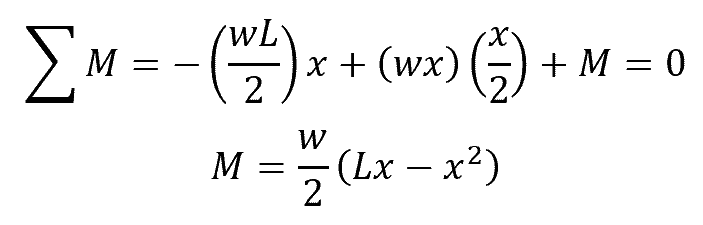
For example, for a simply supported beam of length (L) subjected to a uniform loading (w), shown in the diagram above, the support reactions are identified to be equal to (wL/2). We can cut a section of this beam at an arbitrary position (x) from the left end of the beam, as shown in the following free-body diagram.
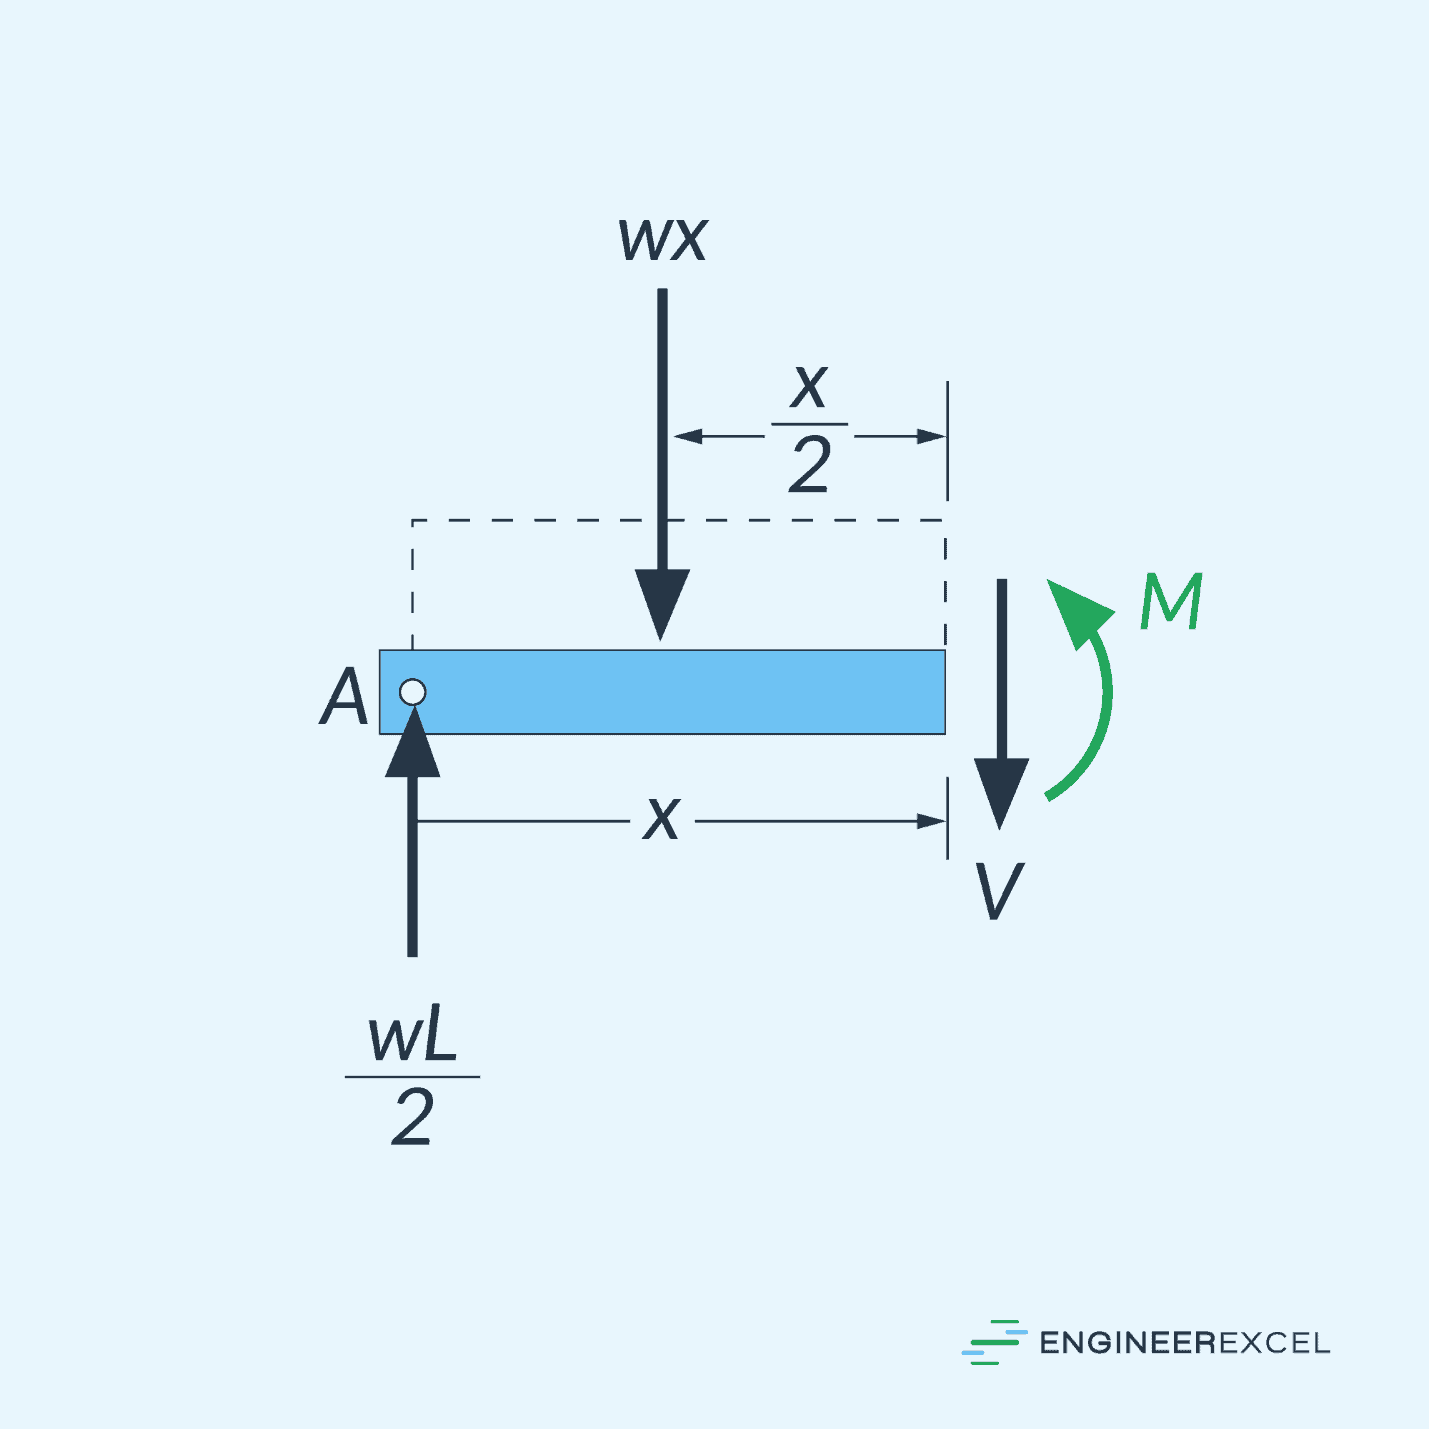
In order to derive an expression for the bending moment, we can sum moments about the sectioned end of the segment, such that:
Where:
- M = bending moment at x [N-m]
- x = arbitrary position measured from the left end of beam [m]
- w = applied uniform loading [N/m]
- L = length of the beam [m]
The resulting bending moment diagram is as follows: