
Relative roughness is a critical parameter in fluid flow analysis that characterizes the roughness of a pipe’s internal surface. Engineers use this dimensionless quantity to optimize pipe design and select suitable materials for specific fluid transport applications.

In this article, we will discuss what relative roughness is, factors that affect it, methods to measure it, and its application in fluid mechanics.
What is Relative Roughness
Relative roughness is a dimensionless quantity used to characterize the roughness of a pipe’s internal surface. It is a critical parameter in fluid flow analysis, as it affects the frictional resistance that arises when fluids flow through pipes. The concept of relative roughness helps engineers optimize pipe design and select suitable materials for specific fluid transport applications.
Relative roughness is defined as the ratio of the surface roughness (ε) to the pipe’s internal diameter (D). Mathematically, it is expressed as:

Elevate Your Engineering With Excel
Advance in Excel with engineering-focused training that equips you with the skills to streamline projects and accelerate your career.
Where:
- ε = surface roughness [mm or in]
- D = pipe hydraulic diameter [mm or in]
Surface roughness represents the average height of surface irregularities, also known as “roughness height.” This value may vary depending on the manufacturer and the production methods used.
Factors Affecting Relative Roughness
Several factors can influence the relative roughness of a pipe and, consequently, affect fluid flow behavior and performance.
Material Properties
The selection of pipe materials and their inherent resistance to corrosion and erosion can significantly impact the resulting surface roughness. Commonly used materials for pipes include galvanized iron, cast iron, concrete, PVC, and stainless steel, each having its specific roughness parameters, which can be characterized by various parameters such as average roughness and root mean square roughness. For example, metals typically have smoother surfaces than plastics and ceramics, leading to lower relative roughness values.
The following table presents some typical values of surface roughness for various pipe materials:
| Material | Surface Roughness (ε) in meters |
| Galvanized Iron | 0.00015 – 0.0002 |
| Cast Iron | 0.00026 |
| Concrete | 0.001 – 0.003 |
| PVC | 0.0000015 – 0.000007 |
| Stainless Steel | 0.000045 – 0.00009 |
Manufacturing Process
Manufacturing processes also impact relative roughness. For example, machining methods such as milling or turning tend to produce rougher surfaces than finishing processes like polishing or grinding. Additionally, the quality and sharpness of cutting tools, as well as their feed rate and cutting speed, will affect the surface finish and relative roughness.
Surface Features
The size and shape of surface features, or roughness elements, contribute to the overall relative roughness. Roughness elements include bumps, valleys, and scratches on a surface. Larger and more irregular features result in higher relative roughness values, leading to an increased influence on fluid flow.
Surface coatings, treatments, and condition can further affect relative roughness, by either smoothing or roughening the surface. For example, applying a polymeric coating can decrease relative roughness by filling in surface imperfections.
Conversely, exposure to corrosive environments can increase surface roughness through material degradation. Wear and tear processes can also modify the roughness over time.
Pipe Size
Lastly, relative roughness is directly influenced by pipe size. In general, the relative roughness decreases as the pipe diameter increases. Assuming the same material, smaller pipes have a higher relative roughness, which leads to increased frictional losses and pressure drop, while larger pipes have a lower relative roughness, resulting in reduced frictional losses.
Methods to Measure Relative Roughness
One common technique to measure relative roughness is through a surface profilometer. This instrument scans the surface of a material and records the vertical deviations from a reference plane.

Another approach to measure relative roughness is using optical methods, such as confocal microscopy and interferometry. These techniques involve shining a light source onto the surface and analyzing the resulting light reflections or interference patterns to determine the surface profile. By assessing the profile data, engineers can evaluate the relative roughness of the conduit with high resolution and accuracy.
In some applications, engineers may use contact methods like stylus profilometry to measure the surface roughness. This technique works by dragging a sharp stylus across the surface, measuring the vertical displacements of the stylus as it moves over the surface features. However, stylus profilometry can cause wear and damage to the surface, possibly altering the actual roughness.
Lastly, numerical simulations can help predict relative roughness for different materials and manufacturing processes. Computational models that simulate the surface generation process or turbulence effects can provide predictions of relative roughness.
Application of Relative Roughness in Fluid Mechanics
Relative roughness plays a crucial role in fluid flow calculations, particularly in determining frictional losses, pressure drops, and flow characteristics.
In general, higher relative roughness leads to an increase in the friction factor, resulting in a higher pressure drop in the fluid flow. This can significantly affect the efficiency of fluid transportation systems, such as those used in water distribution or oil and gas pipelines.
The Moody chart, shown below, is a widely used graphical representation of the relationship between relative roughness, Reynolds number, and the Darcy-Weisbach friction factor for fluid flow in pipes. Engineers can use this chart to determine the friction factor based on the Reynolds number and relative roughness of a given system.
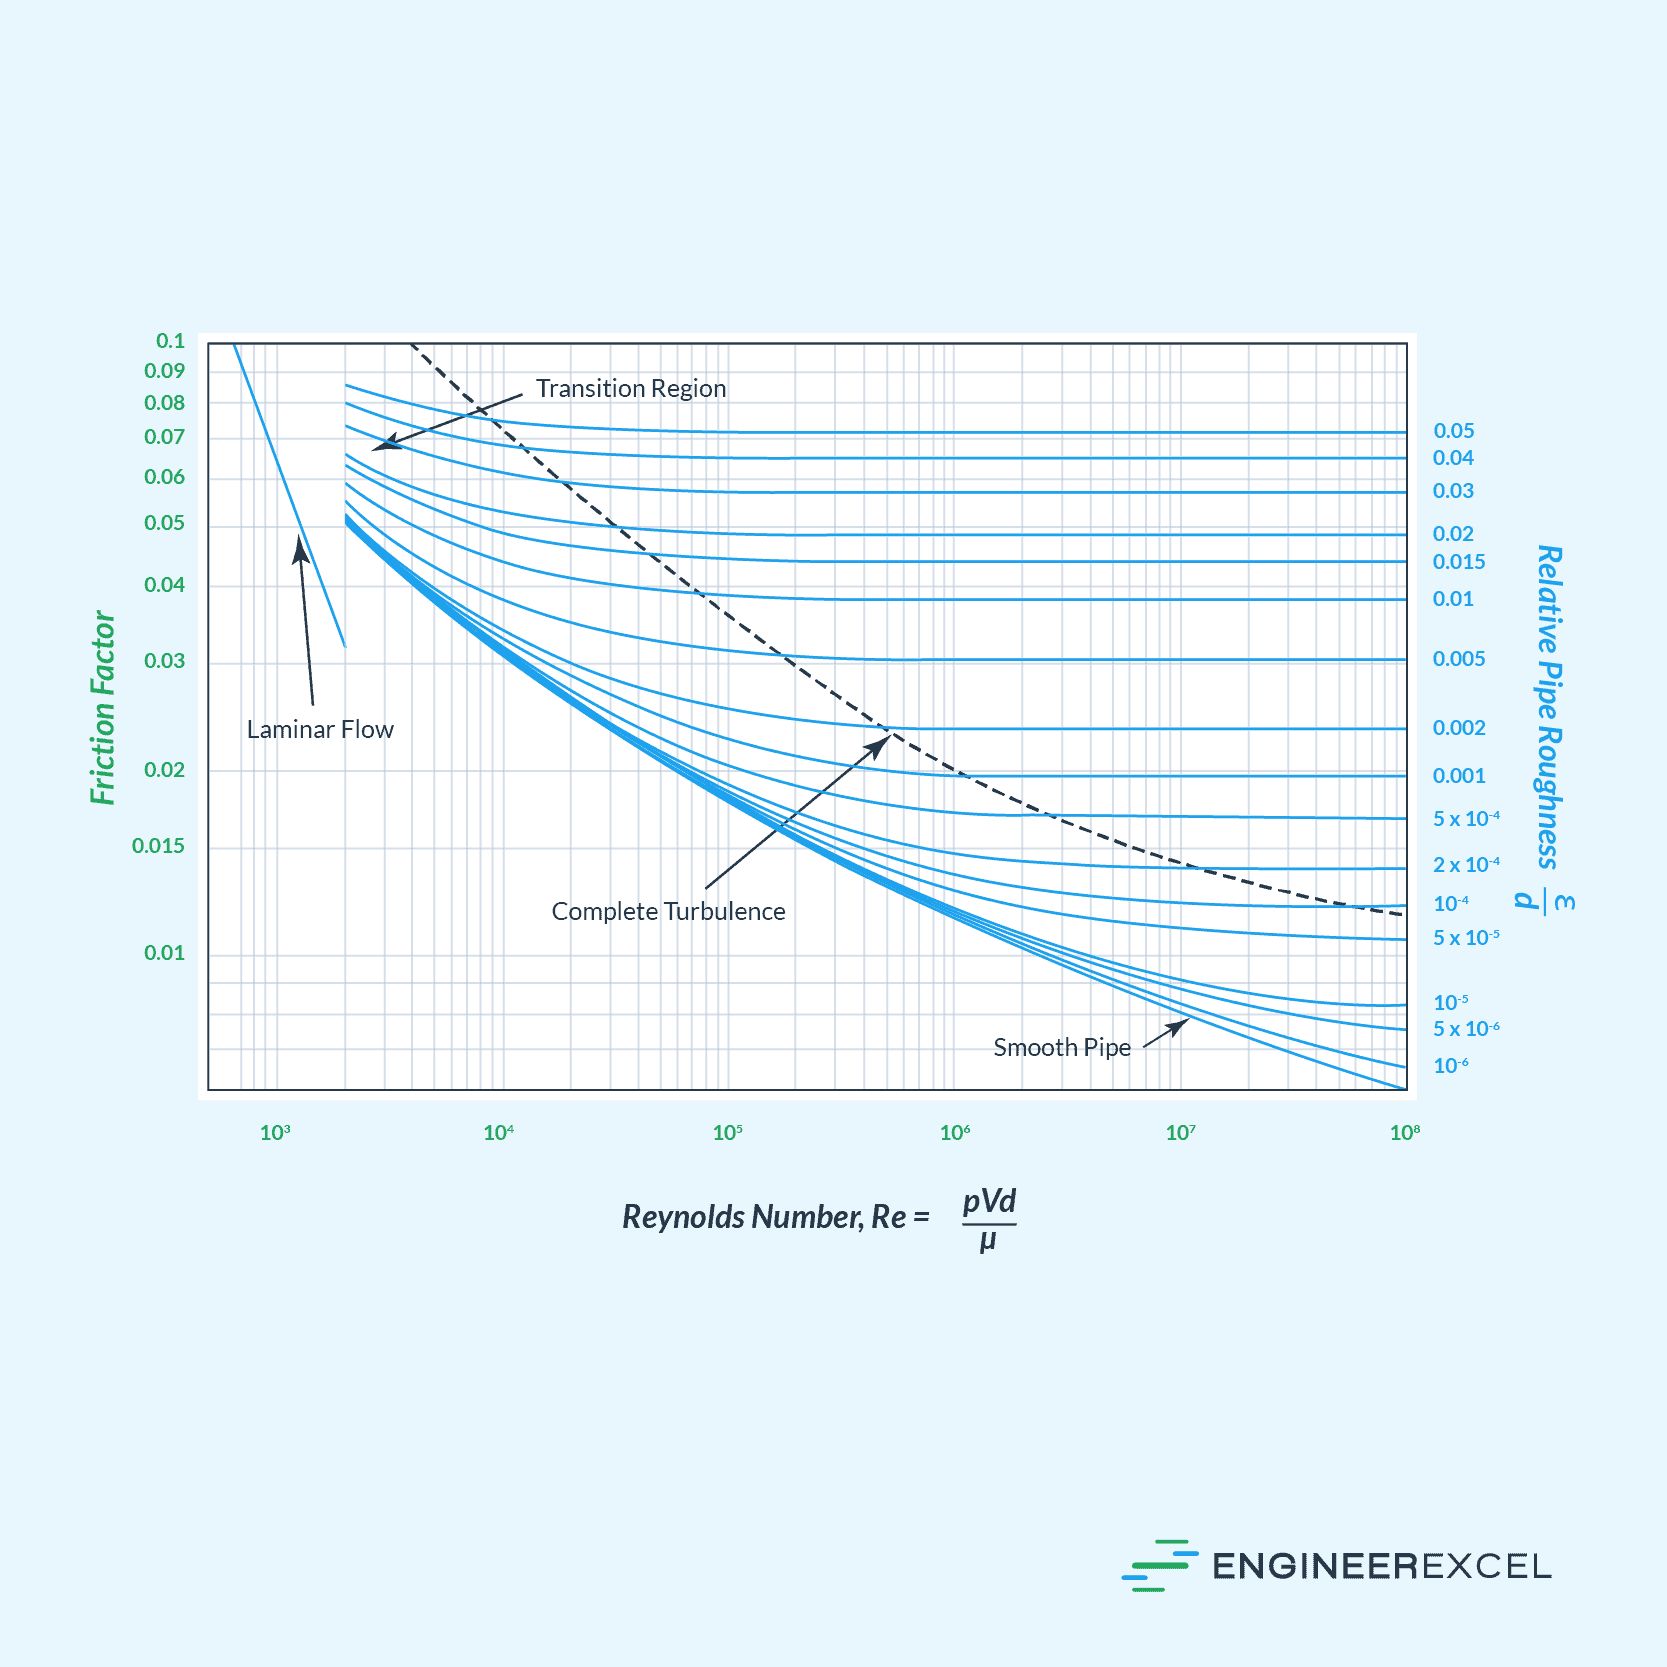
It is important to note that the relative roughness can also affect the critical Reynolds number at which the flow regime transitions from laminar to turbulent and vice versa. In general, higher relative roughness values tend to promote earlier turbulence onset. This means that for pipes with rougher internal surfaces, the critical Reynolds number will be lower than for pipes with smoother surfaces.