
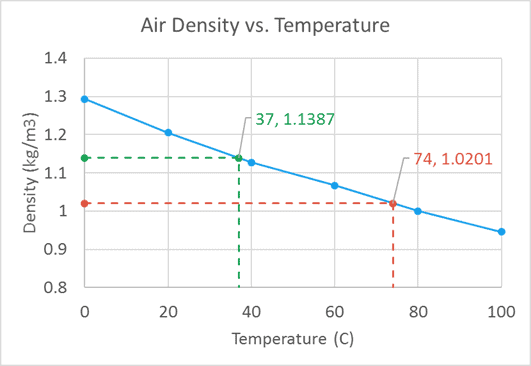
Plot X and Y Coordinates in Excel
If you have a scatter plot and you want to highlight the position of a particular data point on the x- and y-axes, you can […]
Plot X and Y Coordinates in Excel Read More »
If you have a scatter plot and you want to highlight the position of a particular data point on the x- and y-axes, you can […]
Plot X and Y Coordinates in Excel Read More »
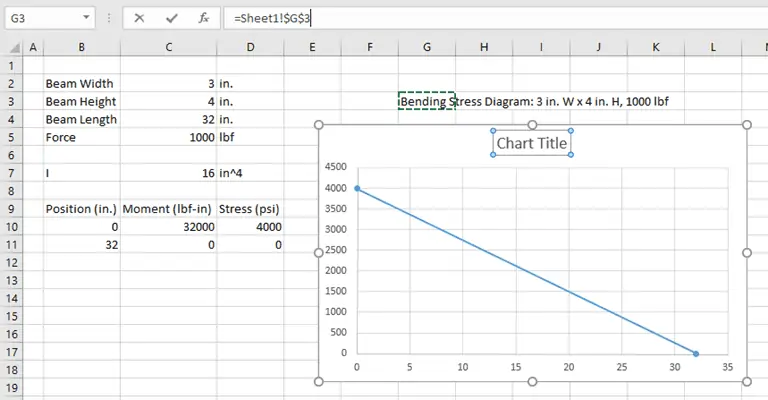
One of the things that makes Excel such a great tool is the ease at which you can automate certain tasks. This creates many opportunities
Dynamic Chart Titles in Excel Read More »
Often, engineers need to display two or more series of data on the same chart. In this section, we’ll add a second plot to the
How to Quickly Add Data to an Excel Scatter Chart Read More »
At some point, you may need to change data that’s already plotted in an XY scatter chart. In our worksheet, we have the data from
3 Ways to Change the Data in an Excel Scatter Chart Read More »