
Imagine facing a spreadsheet filled with numbers from your latest material stress tests. Interpreting them without visual aids can feel like deciphering code. This is where data visualization steps in to save the day! By transforming those raw numbers into charts and graphs, you can quickly spot trends, patterns, and outliers.
In this blog post, we’ll dive into the basics of data visualization using Microsoft Excel—a tool you likely already use daily. You’ll learn how turning your data into clear visuals not only enhances understanding but also aids in making informed engineering decisions. Ready to make your data tell a story? Let’s explore how effective visualization techniques can elevate your engineering projects and bring clarity to complex datasets!
1. Understanding the Basics of Data Visualization
Introduction to Data Visualization
Imagine staring at a table filled with numbers representing material stress testing results. Trying to interpret these numbers without any visual aids can be daunting. This is where data visualization comes in. By converting raw data into charts and graphs, you can quickly grasp trends, patterns, and outliers.
The Importance of Data Visualization in Engineering

Elevate Your Engineering With Excel
Advance in Excel with engineering-focused training that equips you with the skills to streamline projects and accelerate your career.
In engineering, data visualization isn’t just about making data look pretty. It’s about enhancing clarity and aiding decision-making. A well-designed chart can reveal insights that are not immediately obvious from raw data. For instance, identifying the point at which a material fails under stress is much easier when you see it plotted on a graph.
2. Principles of Effective Visualization
Ensuring Clarity in Your Charts
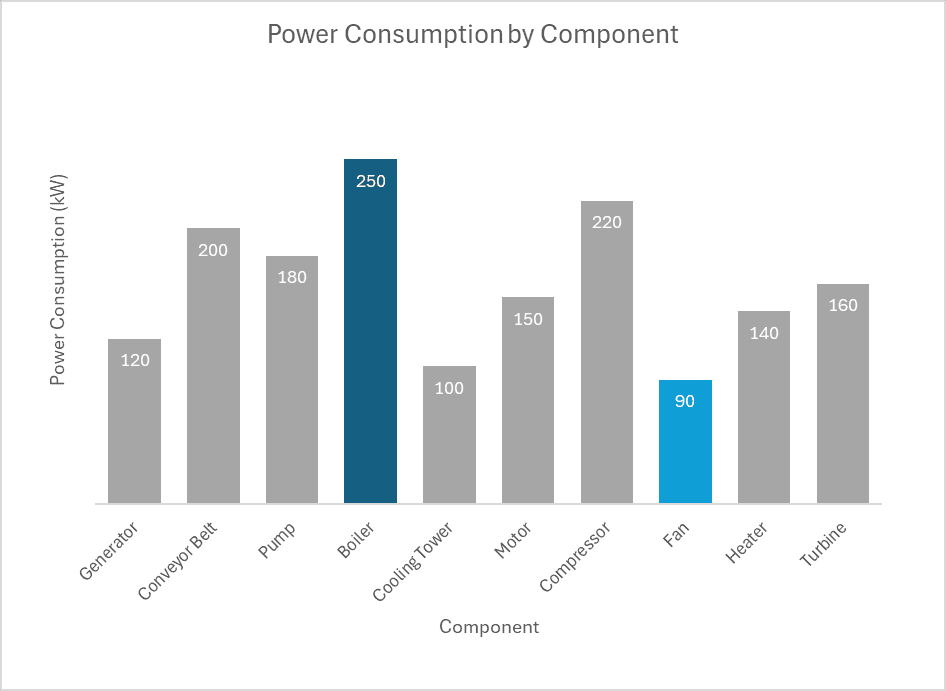
Clarity is vital in data visualization. A cluttered chart can obscure the very insights you’re trying to highlight. For example, grid lines and excessive data labels can make a bar chart hard to read. To enhance clarity, only include essential elements and use a clean, simple design.
Maintaining Accuracy to Avoid Misinterpretation
Accuracy is another critical principle. Common mistakes like truncated axes or inappropriate scaling can mislead your audience. For example, adjusting the axis scale on a bar chart can exaggerate differences between data points, leading to incorrect conclusions. Always ensure your visualizations accurately represent the data.
Conveying the Right Message with Appropriate Chart Types
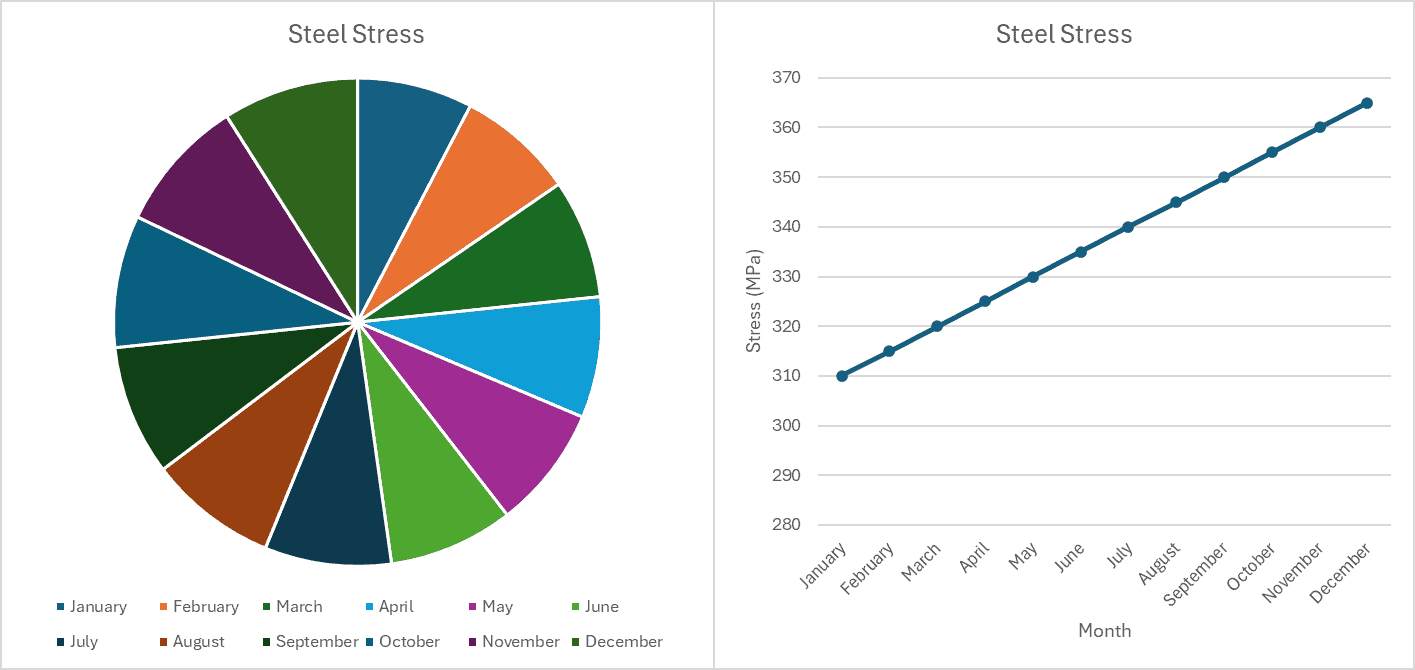
Choosing the right chart type is crucial for conveying the correct message. For instance, using a pie chart for continuous data is inappropriate and can confuse your audience. Instead, consider using a line chart to show changes in data over time.
3. Exploring Different Types of Visualizations
Overview of Common Chart Types
Excel offers a variety of chart types, each suited to different kinds of data:
- Line Charts: Ideal for showing trends over time.
- Bar Charts: Great for comparing categorical data.
- Pie Charts: Useful for showing proportions within a whole.
- Scatter Plots: Excellent for displaying relationships between variables.
Deep Dive into Scatter Plots and Their Engineering Applications
Scatter plots are particularly valuable in engineering. They allow you to visualize the relationship between two variables, such as stress and strain. By plotting these variables on a scatter plot, you can easily identify correlations and trends. Adding a trend line can further help in analyzing the data.
4. Practical Guide to Creating Basic Charts and Graphs
Step-by-Step Instructions for Line, Bar, Pie, and Scatter Charts
Creating charts in Excel is straightforward. Here’s a quick guide to get you started:
– Line Chart: Select your data range, go to the “Insert” tab, and choose “Line Chart.” Adjust the axis titles and gridlines for clarity. Adding a trend line can help identify general trends in the data.
– Bar Chart: Select your categorical data, insert a bar chart, and sort or categorize bars effectively. Adjusting bar spacing, labels, and colors can emphasize differences.
– Pie Chart: Use data that represents a whole and its components. Insert a pie chart, customize the legend, data labels, and slice colors. Be mindful of the limitations of pie charts, especially with too many or too few slices.
– Scatter Plot: Plot data that shows correlation, like stress versus strain. Insert a scatter plot, adjust the axes, and add gridlines and trend lines for better analysis.
Formatting Essentials: Axes, Labels, Colors, and Styles
Formatting your charts is crucial for readability and impact. Here are some tips:
– Axes and Labels: Always label your axes clearly and adjust the scale to fit the data. For example, if you’re plotting stress over time, ensure the time axis is appropriately scaled.
– Colors and Styles: Use consistent colors for specific data points across charts. This helps in maintaining a cohesive look and makes it easier for the audience to follow.
– Legends and Gridlines: Position legends where they don’t obstruct the data. Toggle gridlines on or off based on what enhances readability.
5. Advanced Techniques to Enhance Your Visualizations
Using Conditional Formatting to Highlight Key Trends
Conditional formatting is a powerful Excel feature that can highlight patterns and key indicators within your data tables. Here’s how you can use it effectively:
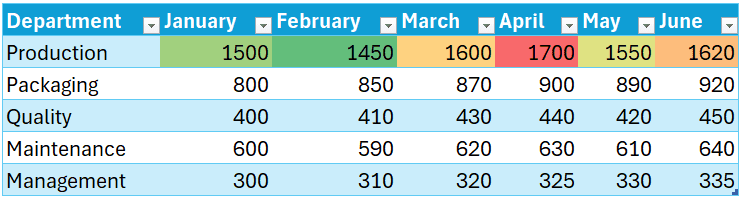
– Color Scales: Apply a 2-color scale to show high and low values. For instance, in a table of monthly energy consumption, you can use color scales to quickly identify months with the highest and lowest consumption.
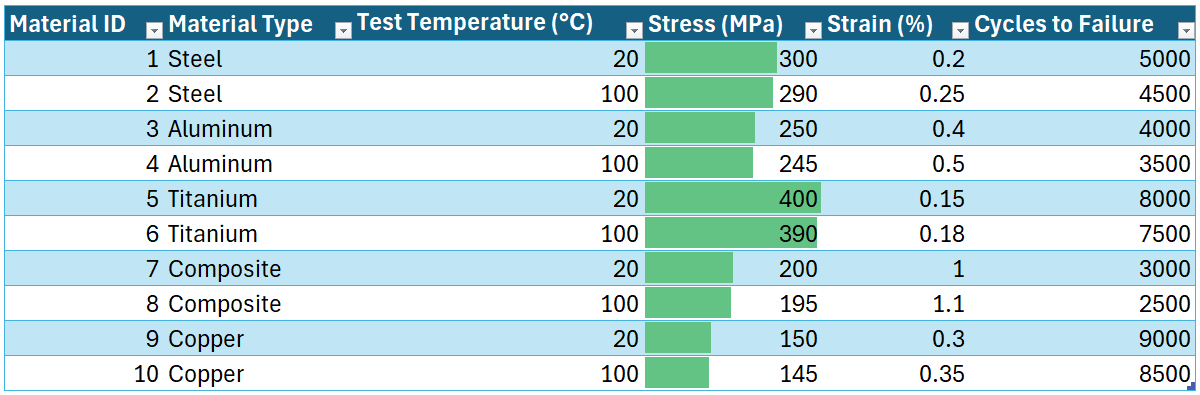
– Data Bars: Use data bars to represent relative values visually. For example, in a table showing stress over several weeks, data bars can provide a quick visual representation of relative stress values.
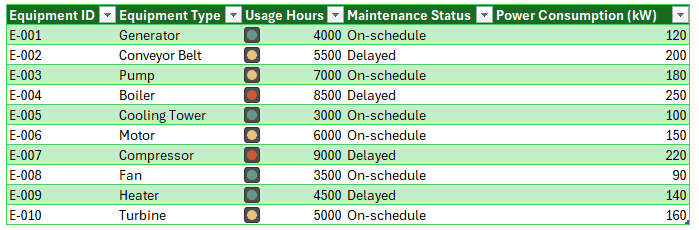
– Icon Sets: Apply icon sets to indicate performance levels. For instance, in an equipment usage analysis table, you can use green, yellow, and red icons to indicate high, medium, and low usage levels.
Enhance Chart Readability with Basic Design Essentials
Design plays a significant role in chart readability. Here are some essentials you should consider:
– Color Choices: Use color consistently and consider accessibility. For example, apply a monochromatic palette for simplicity or ensure your color scheme is accessible to those with color blindness.
– Text Formatting: Make your axis labels and chart titles larger and bolder for better readability. Adjust font sizes for data labels to ensure they are legible without cluttering the chart.
– Layout Considerations: Maintain consistent spacing and organization to make charts visually balanced. For instance, when creating a multi-chart layout, adjust the positioning of legends, titles, and chart sizes for a cohesive look.
Elevate Your Engineering Skills with EngineerExcel Academy
This blog post is based on a new course inside the EngineerExcel Academy that focuses on Data Visualization in Excel for Engineers. If you’re eager to dive deeper into mastering data visualization techniques and enhancing your engineering applications using Microsoft Excel, more comprehensive lessons and resources await you inside the academy. You can learn more and join us at EngineerExcel Academy.