Often times, using a graph or diagram can help simplify evaluating the relationship among parameters for a substance, such as the pressure and temperature. A pressure temperature graph and a pressure temperature diagram are two such tools.
Pressure Temperature Diagram
Another useful visual relating the pressure and temperature of a substance is the pressure temperature diagram. This diagram shows the phases of a substance (solid, liquid, vapor) as they relate to the pressure and temperature. An example of a pressure temperature diagram is shown in the following figure:
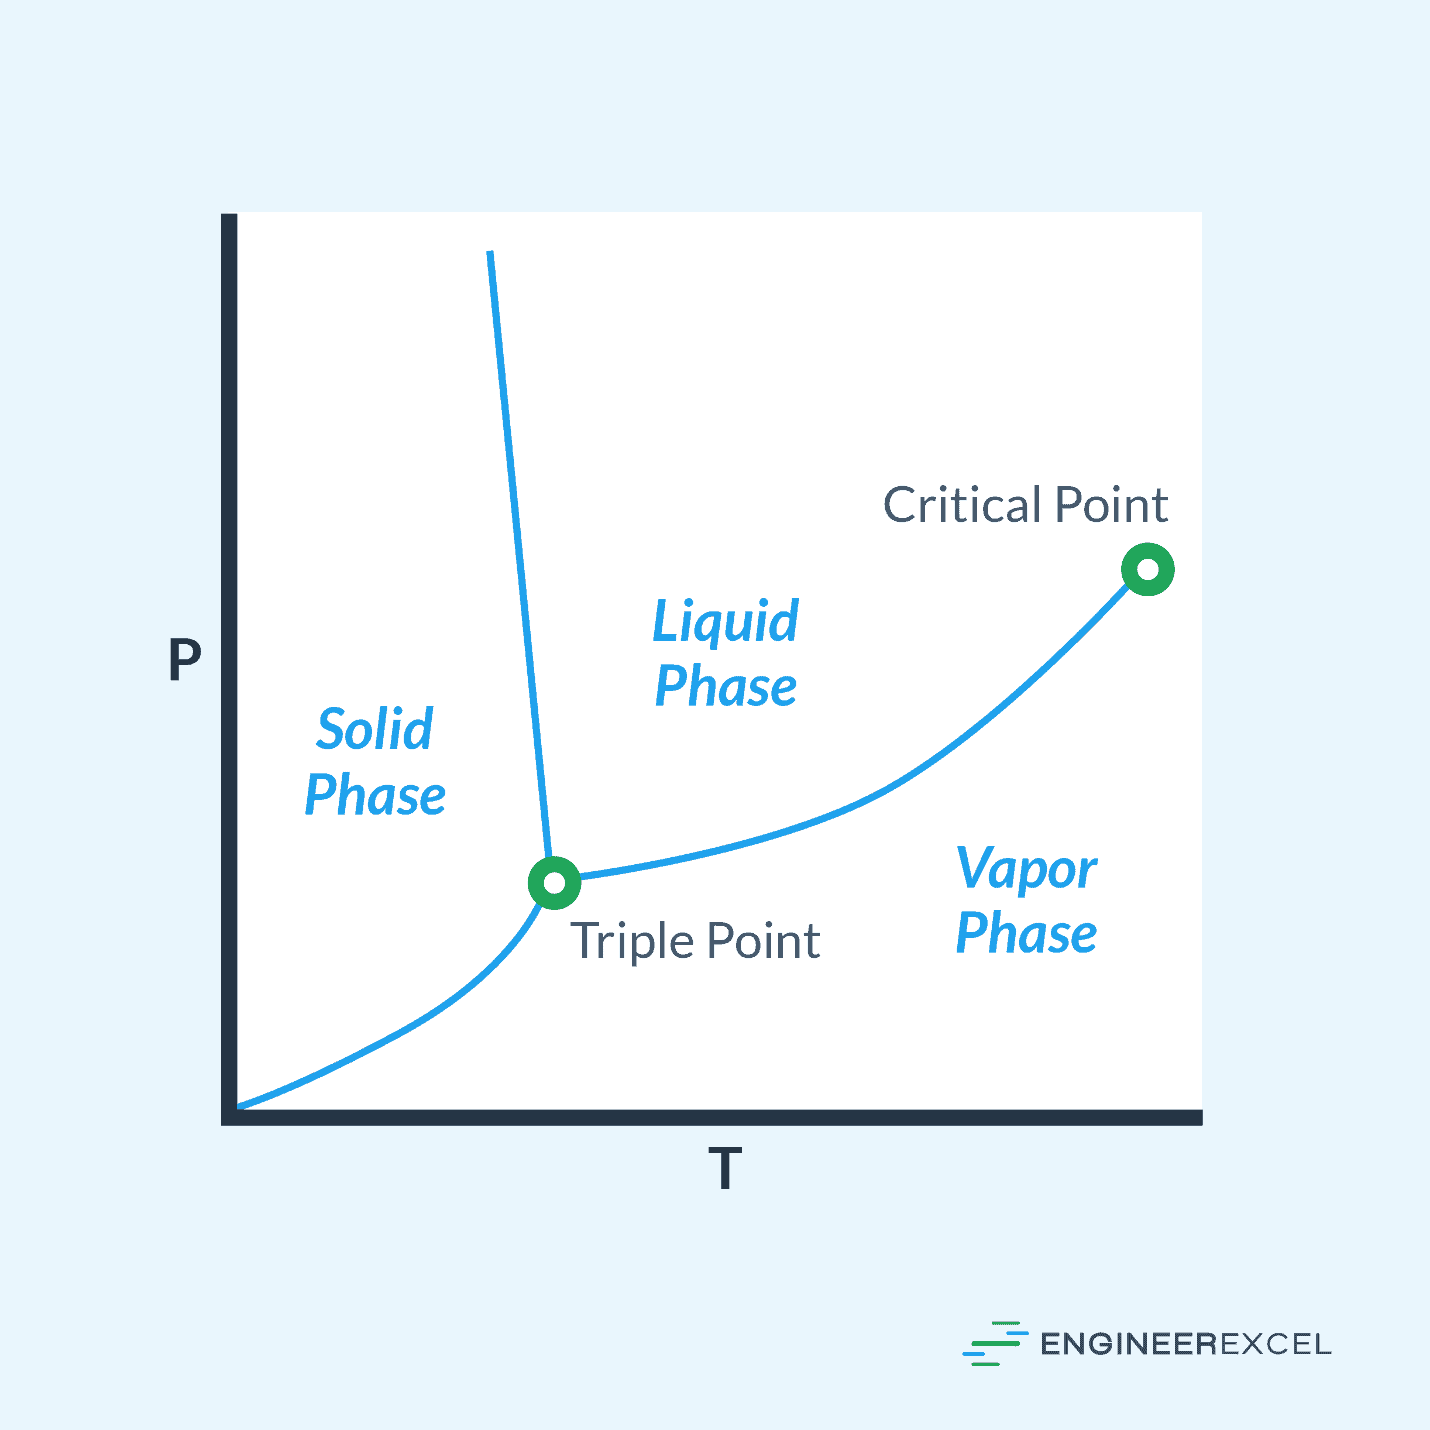
For a given substance, variations in pressure and temperature will cause the transition among phases. On the pressure temperature diagram, these phases are marked along with a couple other specific points, the critical point and the triple point.
Critical Point

Elevate Your Engineering With Excel
Advance in Excel with engineering-focused training that equips you with the skills to streamline projects and accelerate your career.
The critical point on a pressure temperature diagram marks the point along the line between the liquid and vapor phases where increasing temperature will no longer have an impact on the pressure.

Triple Point
The triple point marks the specific pressure and temperature where all three substance phases exist simultaneously. At this point, a given molecule of the substance may transition freely among the three phases.
Phase Lines
The lines between the phases marked on the pressure temperature diagram specify the pressure and temperature where the molecules of the substance transitioning from one phase to another (such as from liquid to vapor) is equal to the molecules transitioning the other way (vapor to liquid).
Example
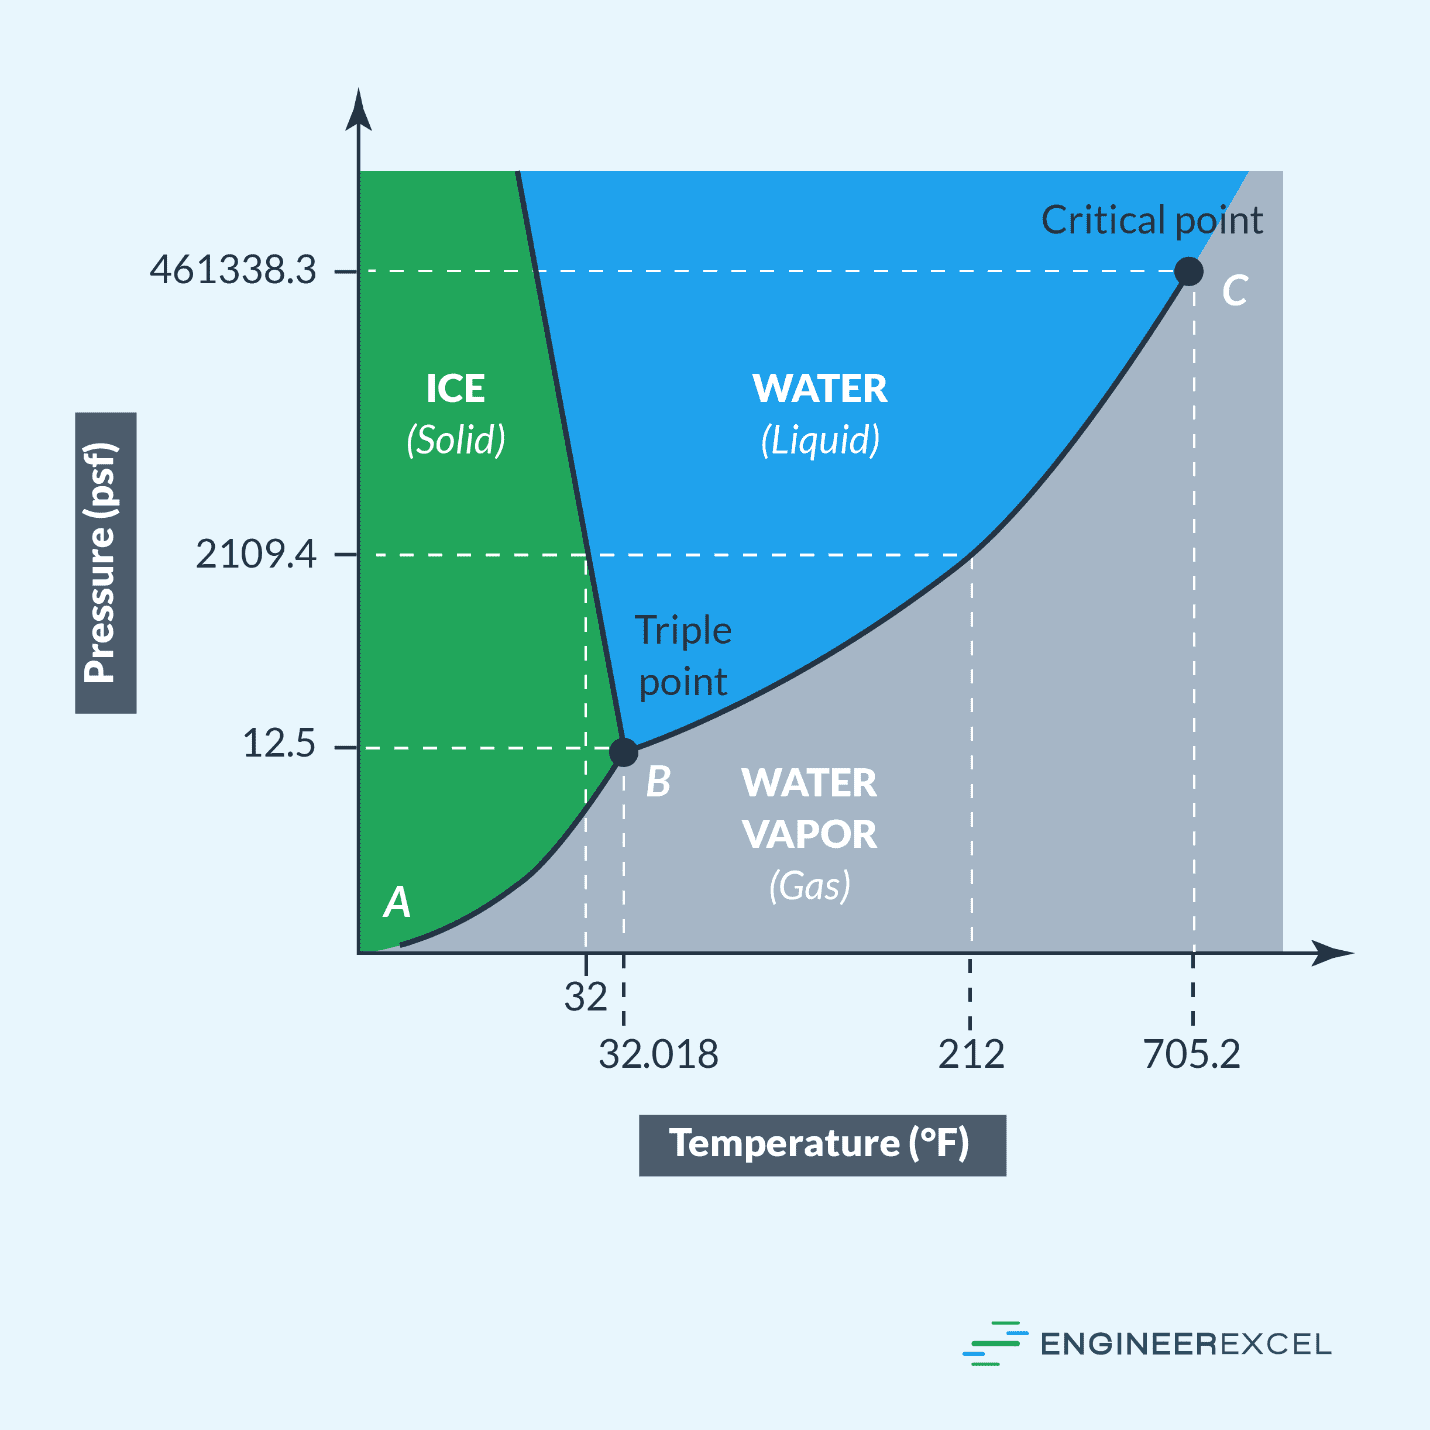
Using a pressure temperature diagram, the phase of a substance at a given pressure and temperature can be determined. For water, whose pressure temperature diagram is shown below, the phase at 105°F and 11 psf is vapor; the phase at 32°F and 47000 psf is liquid; the phase at 307°F and 31000 psf is liquid. These phases demonstrate how differences in pressure and temperature impact the phase of a substance.
Pressure And Temperature Relationship For Ideal Gases
The relationship between pressure and temperature is defined by the Gay-Lussac or Amonton Law of Pressure-Temperature. This law specifies that the pressure a fixed mass of gas exerts in a fixed volume will increase with temperature. This relationship can be expressed with the following equation:
where:
- P is the pressure of the gas, with units of lb/ft2
- T is the temperature of the gas, with units of °F
- k is a constant, which embodies the mass of the gas and the volume of the container
Rearranging the above equation yields the following:
Using the relationship between pressure and temperature, the state of a gas at two points can be related and determined.
Example Calculation
As an example of evaluating the relationship between pressure and temperature, for a gas at a pressure of 100 lb/ft2 at a temperature of 500°F that is heated to 750°F, the final pressure can be calculated as follows:
Pressure Temperature Graph For An Ideal Gas
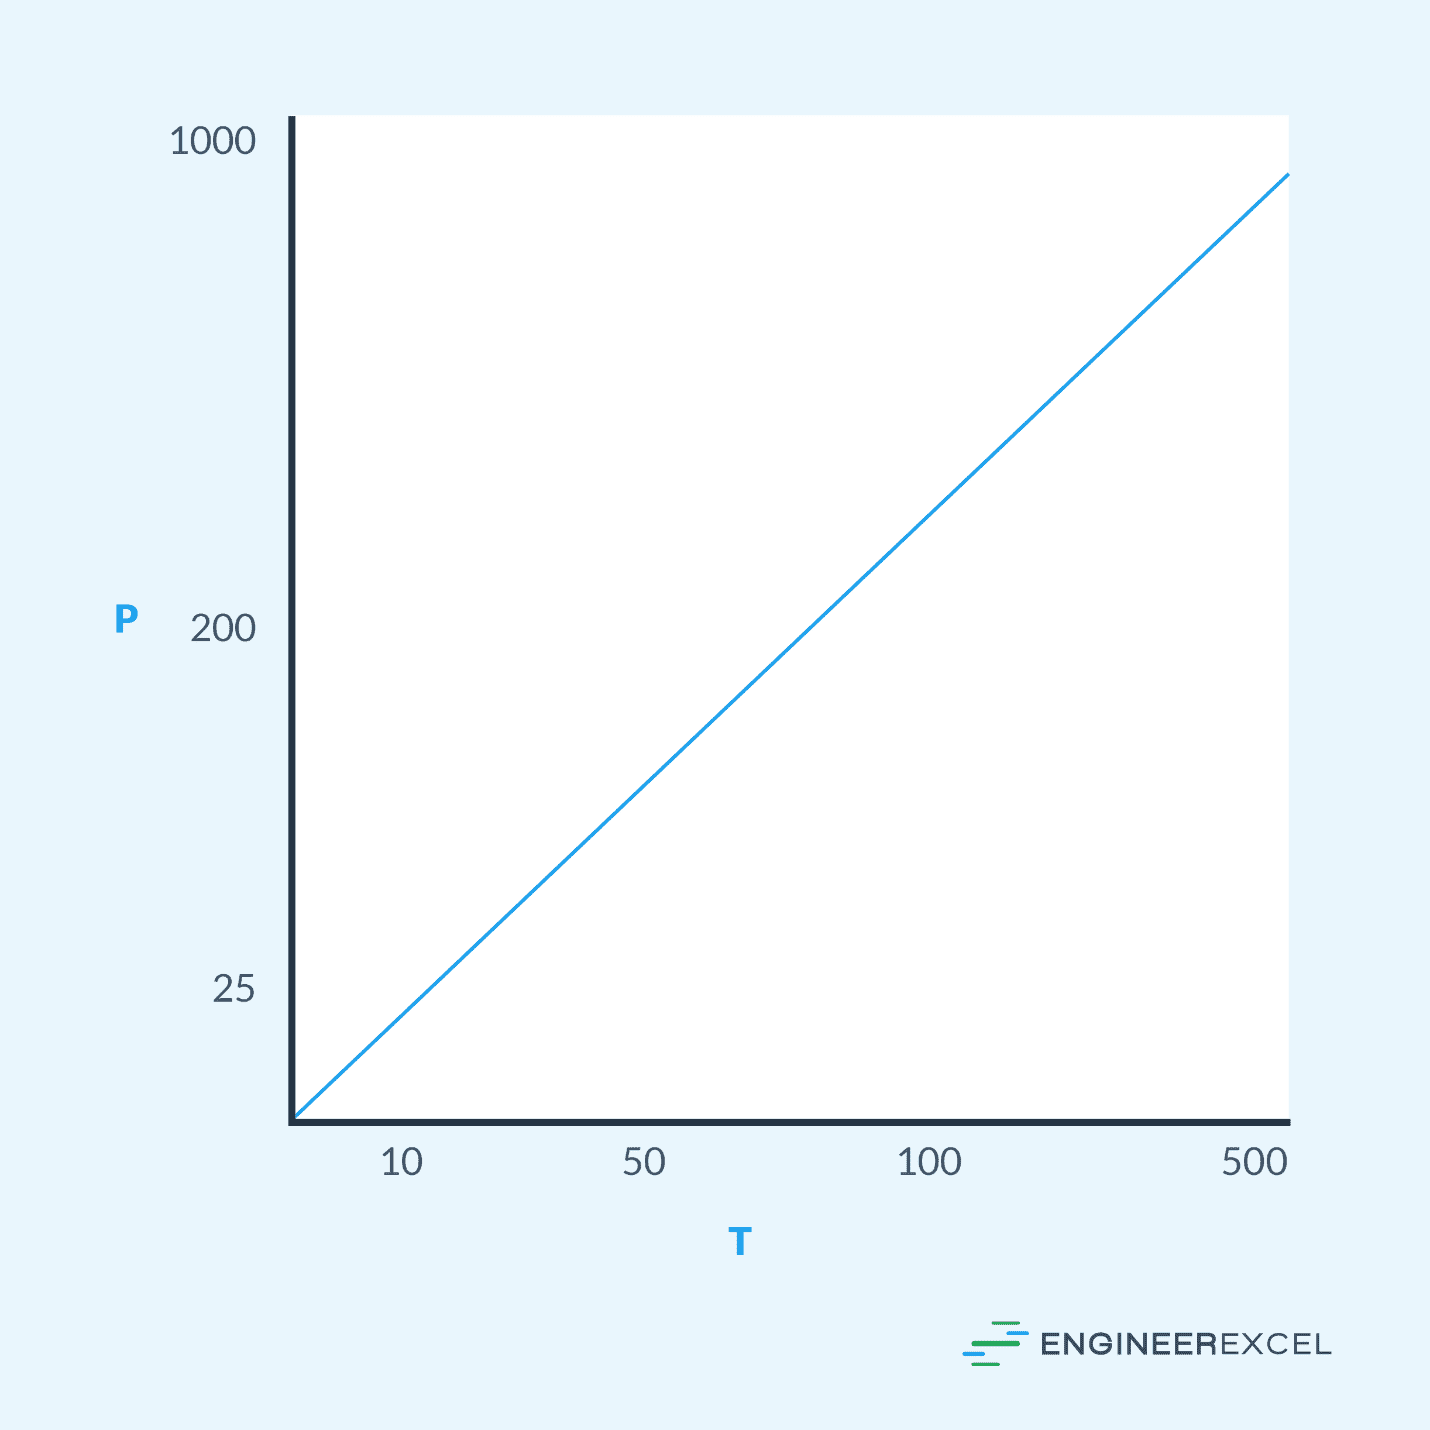
To simplify determining the relationship between the pressure and temperature for a given gas, a pressure temperature graph can be used. These graphs plot the line with the temperature on the x-axis and the pressure on the y-axis. An example pressure temperature graph is shown in the following:
Developing A Pressure Temperature Graph
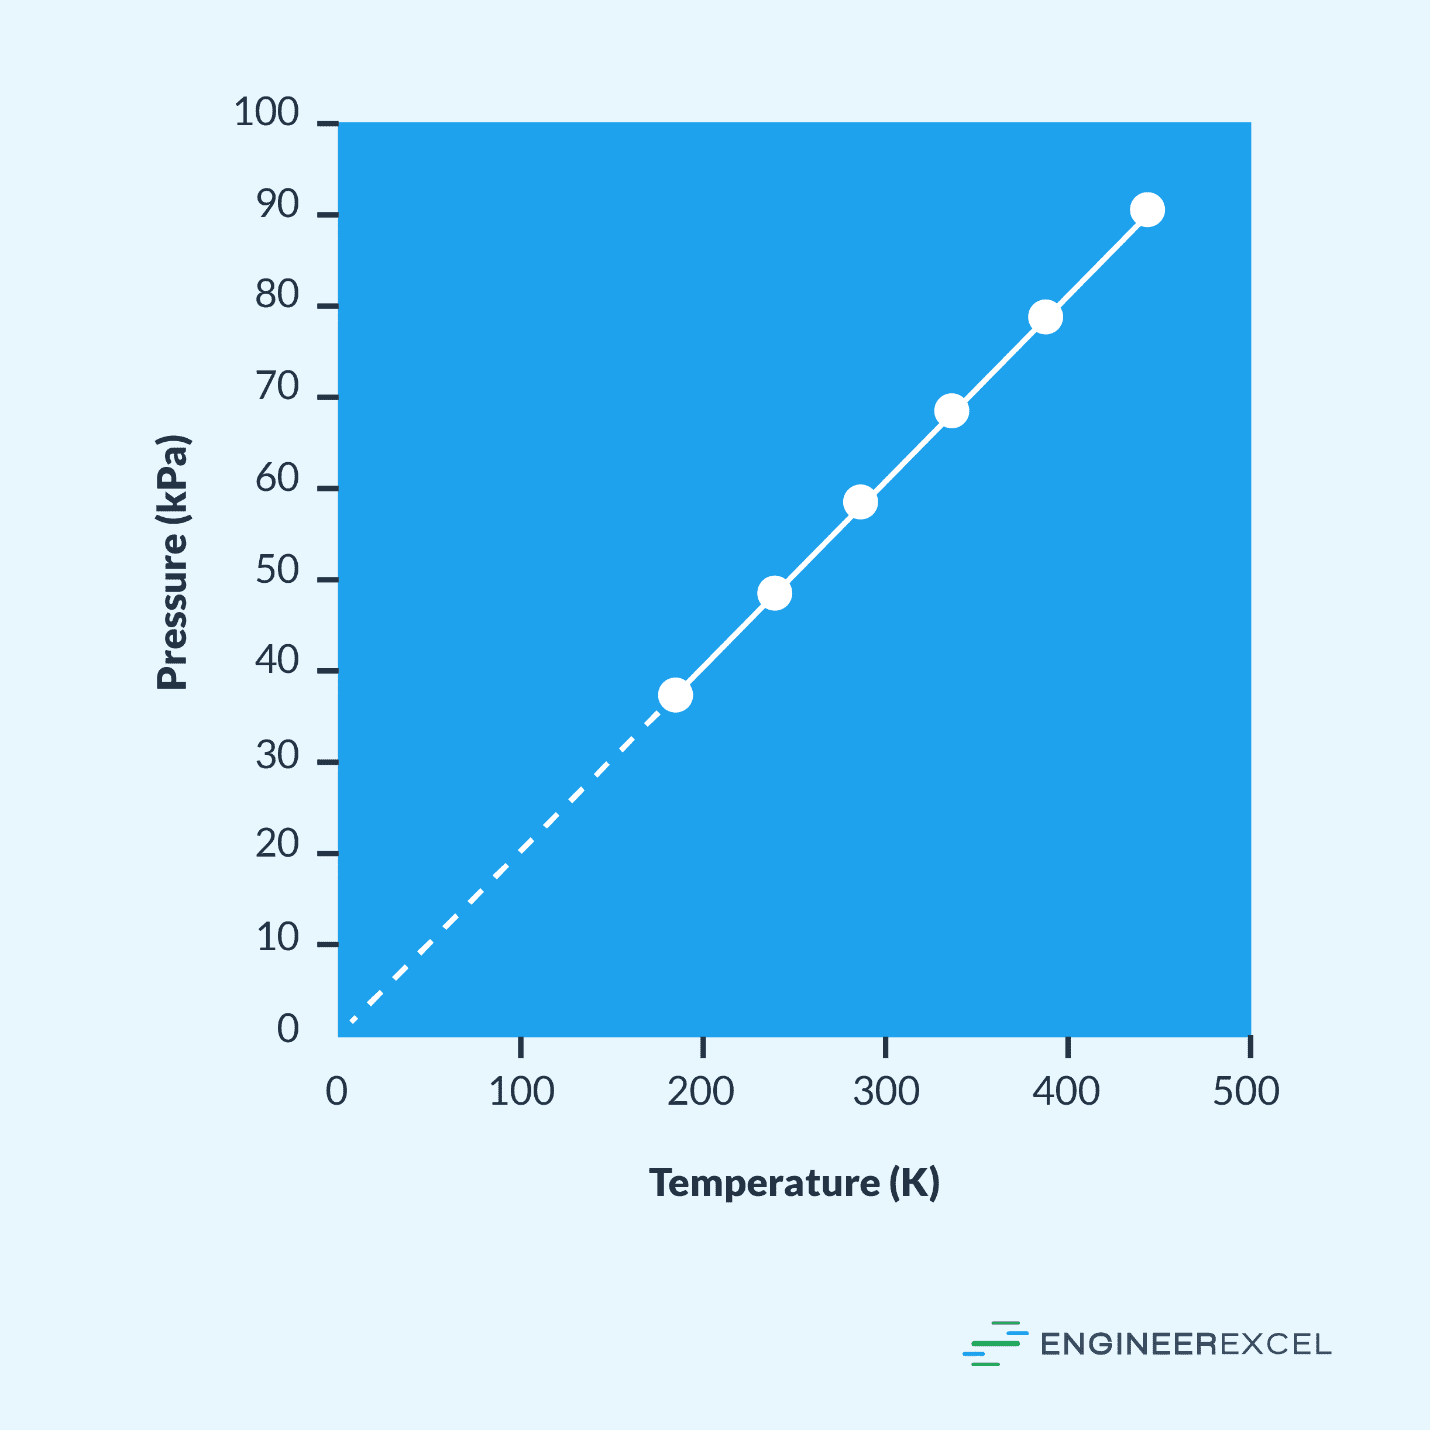
The data used to draw a pressure temperature graph are determined through experimentation. Using a fixed mass of a certain gas in a fixed volume, the pressure of the gas is measured at various temperatures and the data compiled in a table, similar to the one below:
These individual data points are plotted against each other, and the line connecting them is drawn.
Using A Pressure Temperature Graph
To use a pressure temperature graph for a certain gas, either the known temperature or pressure is found on the appropriate axis, and the alternate pressure or temperature value is found using the line.
Example
For a gas with the pressure temperature graph shown below, the pressure at point 1 is 200 psf, so the temperature is 75°F; the temperature at point 2 is 300°F, so the pressure is 600 psf. The linear relationship between the pressure and temperature of a gas allows for the use of a pressure temperature graph to evaluate either the pressure or temperature if the other parameter is known.