
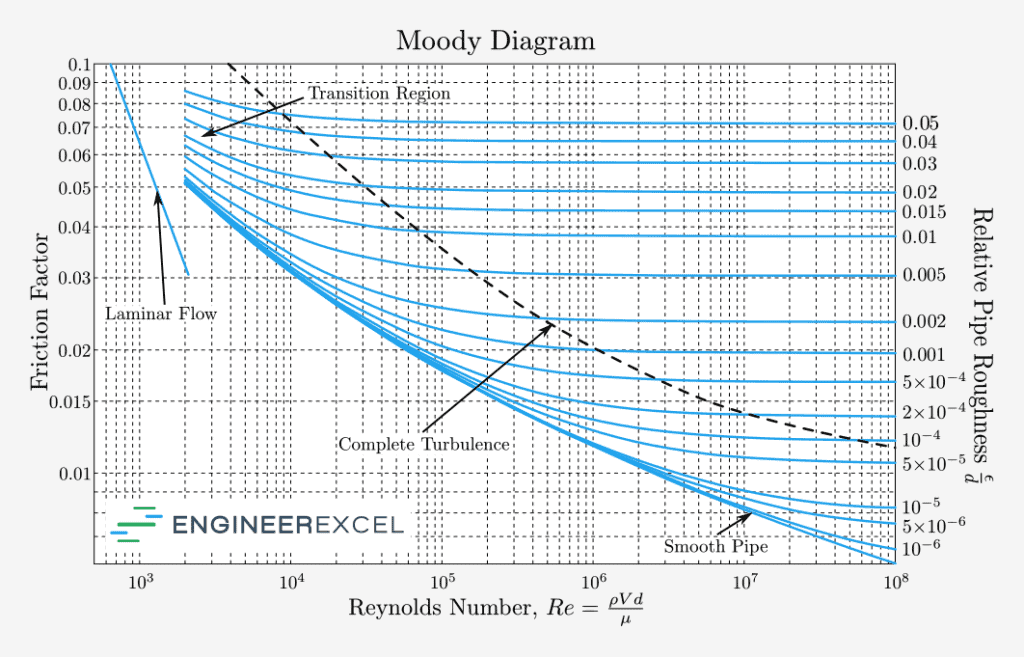
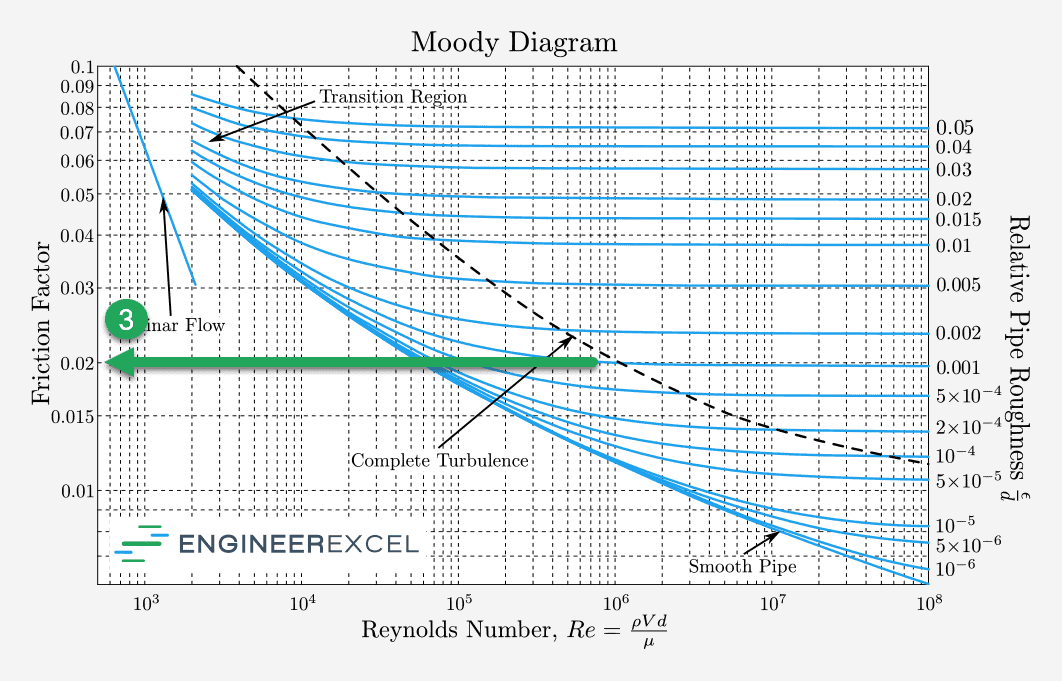
A Moody Chart (or Moody Diagram) is used to estimate the friction factor for fluid flow in a pipe. The chart represents friction factor as a function of Reynolds number and the ratio between internal pipe roughness and pipe diameter, or relative roughness, ε/D.
What is a Moody Chart Used for?
The is commonly used for calculating in a due to , otherwise known as major losses. One of the terms in the equation is the Darcy friction factor.
Although using a is easier to use for one-off calculations, it is not always useful for repetitive calculations or automation of loss calculations due to the need to interpret values from a chart.
How to Read a Moody Chart

Elevate Your Engineering With Excel
Advance in Excel with engineering-focused training that equips you with the skills to streamline projects and accelerate your career.
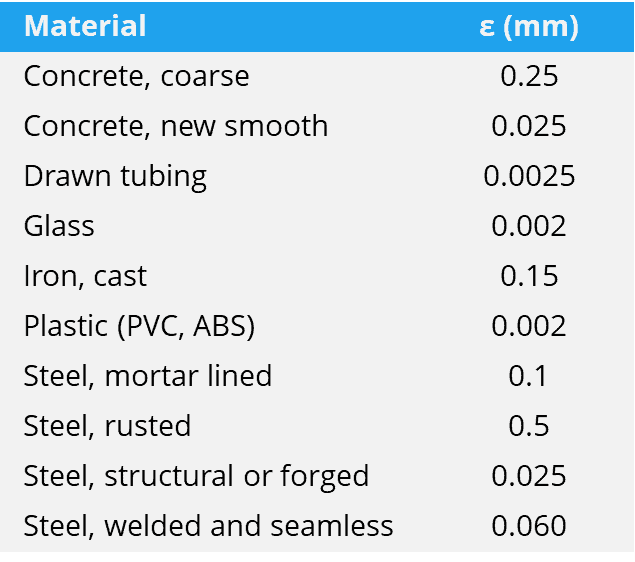
To read a Moody Chart, first calculate the relative roughness of the pipe, ε/D. ε is the roughness height of the internal walls of the pipe and is published in many tables.
Next, calculate the Reynolds number for the fluid flow. Reynolds number is calculated as

where
- ρ = the density of the fluid
- v = the mean fluid velocity
- D = internal diameter of the pipe
- µ = the dynamic viscosity of the fluid
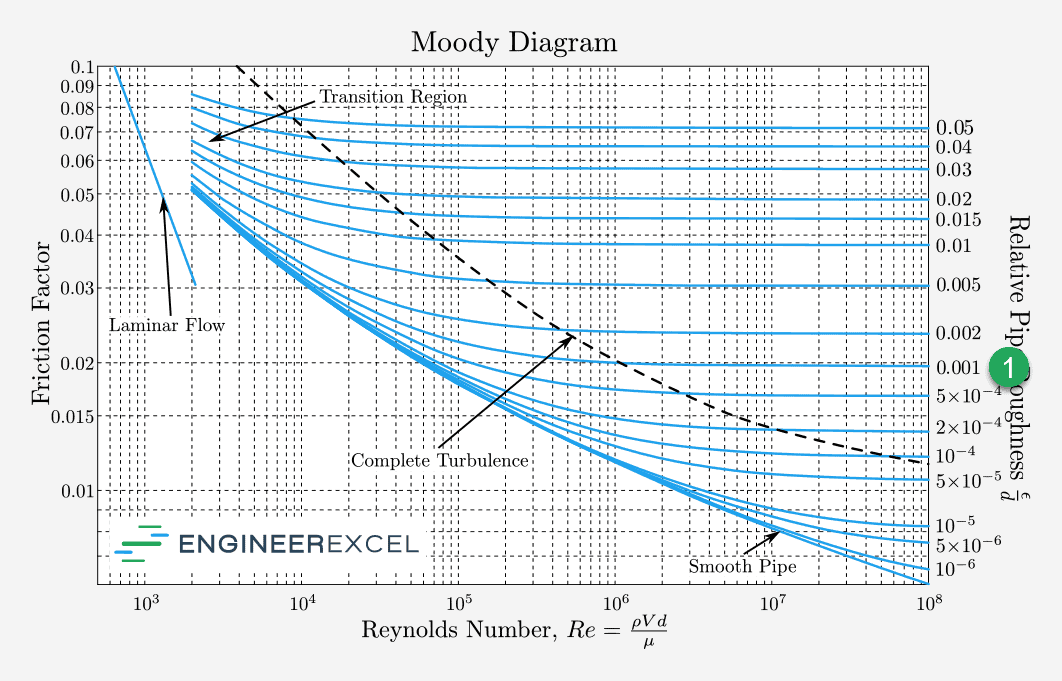
If the relative roughness of a pipe is 0.001, find the corresponding curve from the right side of the Moody diagram (1).
Next, locate the Reynolds number at the bottom of the chart and find where the Reynolds number intersects the curve from above. If the Reynolds number is 8×10⁵, then it intersects the curve at (2).
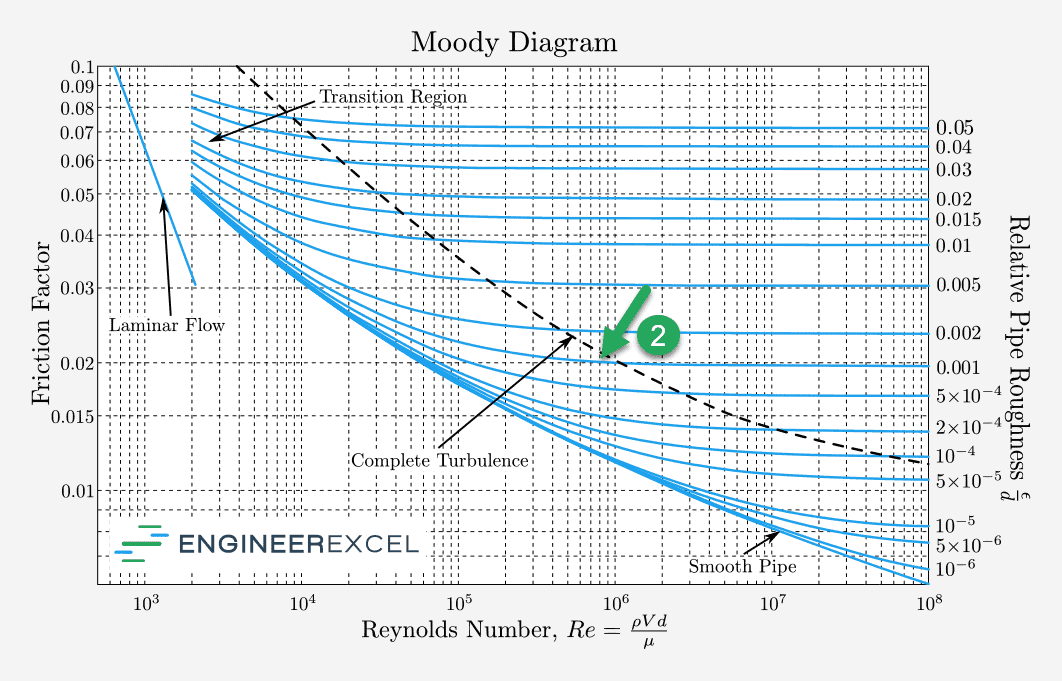
Finally, estimate the friction factor by looking horizontally from the intersection between relative roughness and Reynolds number to the left axis (3). In this example, the friction factor is approximately 0.02.
Moody Diagram .pdf
You can download a .pdf file of a Moody Diagram by clicking on the image below:
How Accurate is a Moody Chart?
A Moody chart is only as accurate as the exactness of the inputs. The most significant source of error, besides reading the chart incorrectly, comes from the roughness height. Values of roughness height found in tables are estimates at best and can vary widely for the same material from different sources. The only way to obtain a truly accurate roughness height is to measure it with a tool like a profilometer.
However, when it’s impossible or impractical to measure roughness height directly, estimates are necessary. In these instances, it is worthwhile to conduct a sensitivity analysis to see how behavior changes with variations in roughness height and friction factor.
Moody Diagram and the Colebrook Equation
The Colebrook Equation is an implicit equation that relates the Darcy friction factor to the Reynolds number, diameter, and pipe roughness, much like the Moody chart. However, it’s a complex equation to solve.
The Moody diagram was created in the early 1940’s before the use of calculators and computers became commonplace. Lewis Moody solved the Colebrook equation for many different combinations of Reynolds number and roughness height and plotted them on a chart.
Moody Diagram for Smooth Pipe
The bottom curve on a Moody chart shows the relationship between friction factor and Reynolds number for a smooth pipe. A theoretically smooth pipe would have a roughness height, and thereby a relative roughness, of zero. However, such a pipe does not truly exist.
Instead, it can be observed from the Moody diagram that as the relative roughness decreases, the friction factor curves become closer together. Essentially, the friction factor begins to converge on a value that is dependent only on the Reynolds number and not on the relative roughness. This creates a lower limit on the value of the friction factor at a given Reynolds number.
Moody Diagram Complete Turbulence
It may be confusing to look at the and see the dashed line labelled “Complete ” when it’s generally understood that flows with a Reynolds number greater than 4000 are turbulent. The dashed line on the Moody diagram seems to indicate that turbulent flow is dependent on both relative roughness and Reynolds number.
The “Complete ” line has to do with viscous effects near the wall of a . For a smooth walled with a relatively low Reynolds number, but still greater than 4000, the near the wall will be because it is dominated by viscous effects.
However, the same through a similarly sized with a very rough wall will be turbulent near the wall because the of the wall will dominate the by causing turbulent eddies and overcoming the tendency of viscosity to make the .