
What is a
A (or ) is a diagram used in the calculation of or due to in . More specifically, a is used to find the for in a .
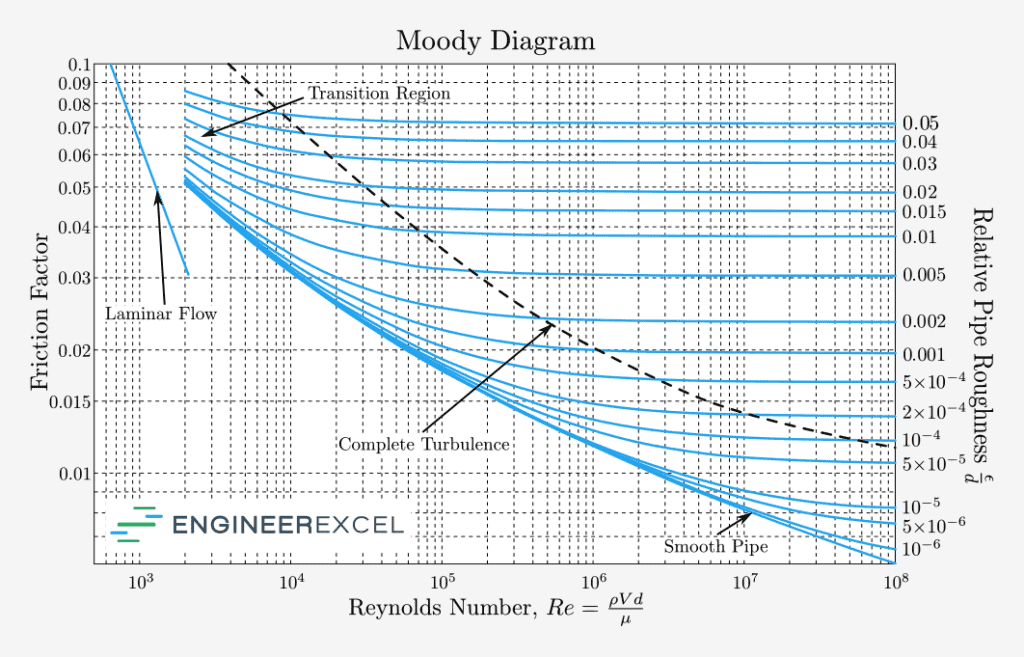
is plotted vs. Reynolds number and on a . is defined as the height, ε, divided by the inside , D. Reynolds number, Re, is the ratio of inertial effects to viscous effects. Reynolds number greater than 4000 indicates turbulent flow, while Reynolds number less than approximately 2000 indicates laminar flow.
Once the Reynolds number and relative roughness are known, the friction factor can be found from the chart and used in the Darcy Weisbach equation for calculating the pressures loss due to friction.

Elevate Your Engineering With Excel
Advance in Excel with engineering-focused training that equips you with the skills to streamline projects and accelerate your career.
The is shown below:

where:
- Δp = [Pa]
- L = the length of the [m]
- fD = Darcy friction factor (or Darcy Weisbach friction factor) [unitless]
- ρ = density [kg/m3]
- v = mean [m/s]
- D = inside (or for non-circular ducts) [m]
: How Does It Work?
The underlying that was used to create the can be solved to obtain a numerical result for the .
Each of the curves on a Moody diagram represent the result of an equation that describes the Darcy friction factor as a function of the relative roughness and Reynolds number. This is called the . It was solved by Lewis Moody in the 1940’s and displayed graphically in what came to be known as the or .
The Colebrook White equation is an equation that was created by fitting a function to experimental data. It is also an implicit that cannot be solved directly for the . The was a necessary tool for finding the at a time when there was not widespread use of graphing calculators or spreadsheets to solve the .
In recent years, several alternative equations have been proposed that relate friction factor to relative roughness and diameter, such as the Haaland Equation and Swamee-Jain equation. These explicit approximations can be used to solve directly for f. The above uses the Haaland .
How to Read a
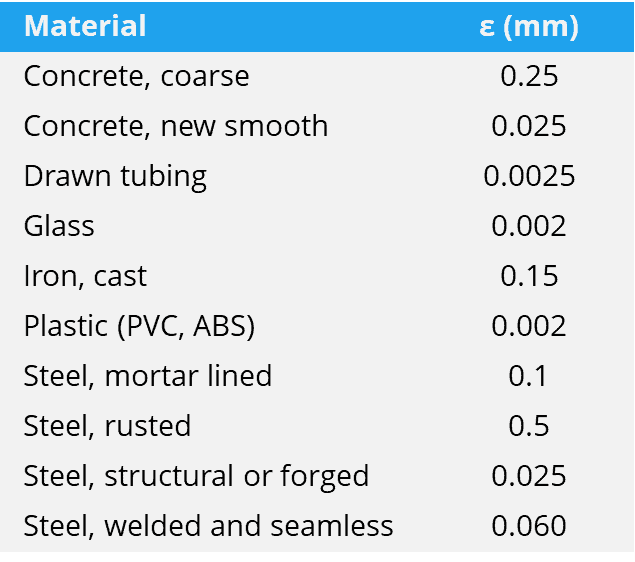
The first step in reading a is to calculate the of the . is the dimensionless ratio of height, ε, to internal , D.
The approximate height, or , of some common materials can be found in the table below:
Once, the has been calculated, find the closest curve of constant relatively from the right axis of the . If the falls between two curves, interpolation may be required.
Next, calculate the Reynolds number for the . Reynolds number is calculated from the following :

where
- ρ = the density
- v = the mean
- D = internal
- µ = the fluid dynamic viscosity
Next, find the point where the curve of intersects the calculated Reynolds number.
Finally, determine the by tracing horizontally from the intersection between the curve and Reynolds number to the left axis. You may need to estimate the value of the if the intersection falls between two factors on the right axis.
The accuracy of estimating a friction factor from a Moody chart is dependent on two things:
- The ability to interpolate for values between the curves of .
- The accuracy of the height value.
With careful usage of the , or by using a , you can eliminate the error due to number 1 above. However, an incorrect height will yield inaccurate results with both the numerical and graphical approaches to finding the .